Quantcast
Channel: HolisticInfoSec™
Viewing all 134 articles
Browse latest View live

toolsmith: Network Security Toolkit (NST) - Packet Analysis Personified

$
0
0


Prerequisites
Virtualization software if you don’t wish to run NST as a LiveCD or install to dedicated hardware.

Introduction
As I write this I’m on the way back from SANS Network Security in Las Vegas where I’d spent two days deeply entrenched analyzing packet captures during the lab portion of the GSE exam. During preparation for this exam I’d used a variety of VM-based LiveCD distributions to study and practice, amongst them Security Onion. There are three distributions I run as VMs that are always on immediate standby in my toolkit. They are, in no particular order, Doug Burk’s brilliant Security Onion, Kevin Johnson’s SamuraiWTF, and Back Track 5 R3. Security Onion and SamuraiWTFhave both been toolsmith topics for good reason; I’ve not covered Back Track only because it would seem so cliché. I will tell you that I am extremely fond of Security Onion and consider it indispensable. As such, I hesitated to cover the Network Security Toolkit (NST) when I first learned of it while preparing for the lab, feeling as if it might violate some code of loyalty I felt to Doug and Security Onion. Weird I know, and the truth is Doug would be one of the first to tell you that the more tools made available to defenders the better. NST represents a number of core principles inherent to toolsmith and the likes of Security Onion. NST is comprehensive and convenient and allows the analyst almost immediate and useful results. NST is an excellent learning tool and allows beginners and experts much success in discovering more about their network environments. NST is also an inclusive, open project that grows with help from an interested and engaged community. The simple truth is Security Onion and NST represent different approaches to complex problems. We all have a community to serve and the same goals at heart, so I got over my hesitation and reached out to the NST project leads.
The Network Security Toolkit is the brainchild of Paul Blankenbaker and Ron Henderson and is a Linux distribution that includes a vast collection of best-of-breed open source network security applications useful to the network security professional. In the early days of NST Paul and Ron found that they needed a common user interface and unified methodology for ease of access and efficiency in automating the configuration process. Ron’s background in network computing and Paul’s in software development lead to what is now referred to as the NST WUI (Web User Interface). Given the wide range of open source networking tools with corresponding command line interface that differ from one application to the next, this was no small feat. The NST WUI now provides a means to allow easy access and a common look-and-feel for many popular network security tools, giving the novice the ability to point and click while also providing advanced users (security analysts, ethical hackers) options to work directly with command line console output.
According to Ron, one of the most beneficial tool enhancements that NST has to offer for the network and security administrator is the Single-Tap and Multi-Tap Network Packet Capture interface. Essentially, adding a web-based front-end to Wireshark, Tcpdump, and Snort for packet capture analysis and decode has made it easy to perform these tasks using a web browser. With the new NST v2.16.0-4104 release they took it a step forward and integrated CloudShark technology into the NST WUI for collaborative packet capture analysis, sharing and management.
Ron is also fond of the Network Interface Bandwidth monitor.  This tool is an interactive dynamic SVG/AJAX enabled application integrated into the NST WUI for monitoring Network Bandwidth
usage on each configured network interface in pseudo real-time. He designed this application with the controls of a standard digital oscilloscope in mind.
Ron is also proud of NST’s ability to Geolocate network entities. We’ll further explore using NST’s current repertoire of available network entities that can geolocated with their associated application, as well as Ron’s other favorites mentioned above.
Paul also shared something I enjoyed as acronyms are so common in our trade. He mentioned that the NST distribution can be used in many situations. One of his personal favorites is related to the FIRST Robotics Competition (FRC) which occurs each year. FIRST for Paul is For Inspiration and Recognition of Science and Technology where I am more accustomed to its use as Forum for Incident Response and Security Teams. Paul mentors FIRST team 868, the TechHounds at the Carmel high school in Indiana, where in FRC competitions, teams have used NST (or could use) during a hectic FRC build season:
·      Quickly identity which network components involved with operating the robot are "alive"
o   From the WUI menu: Security -> Active Scanners -> ARP Scan (arp-scan)
·         Observe how much network traffic increases or decreases as we adjust the IP based robot camera settings
o   From the WUI menu: Network -> Monitors -> Network Interface Bandwidth Monitor
·         Capture packets between the robot and the controlling computer
·         Scan the area for WIFI traffic and use this information to pick frequencies for robot communications that are not heavily used
·         Set up a Subversion and Trac server for managing source code through the build season.
o   From the WUI menu: System -> File System Management -> Subversion Manager
·         Teach the benefits of scripting and automating tasks
·         Provide an environment that can be expanded and customized
While Paul and team have used NST for robotics, it’s quite clear how their use case bullet list applies to the incident responder and network security analyst. 

Installing NST

NST, as an ISO, can be run as LiveCD, installed to dedicated hardware, and also as a virtual machine.If you intend to take advantage of the Multi-Tap Network Packet Capture interface feature with your NST installation set up as a centralized, aggregating sensor then you’ll definitely want to utilize dedicated hardware with multiple network interfaces. As an example, Figure 1displays using NST to capture network and port address translation traffic across a firewall boundary.

Figure 1: Multi-Tap Network Packet Capture Across A Firewall Boundary - NAT/PAT Traffic
Once booted into NST you can navigate from Applications to System Tools to Install NST to Hard Drive in order to execute a dedicated installation.
Keep in mind that when virtualizing you could enable multiple NICs to leverage multi-tap, but your performance will be limited as you’d likely do so on a host system with one NIC.

Using NST

NST use centers around the WUI; access it via Firefox on the NST installation at http://127.0.0.1/nstwui/main.cgi. 
The first time you login, you’ll be immediately reminded to change the default password (nst2003). After doing so, log back in and select Tools-> Network Widgets -> IPv4 Address. Once you know what the IP address is you can opt to use NST WUI from another browser. My session as an example: https://192.168.153.132/nstwui/index.cgi.
Per Ron’s above mentioned tool enhancements, let’s explore Single-Tap Network Packet Capture (I’m running NST as a VM). Click Network -> Protocol Analyzers -> Single-Tap Network Packet Capturewhere you’ll be presented with a number of options regarding how you’d like to configure the capture. You can choose define the likes of duration, file size, and packet count or select predefined short or long capture sessions as seen in Figure 2.

Figure 2: Configure a Single-Tap capture with NST
If you accepted defaults for capture storage location you can click Browseand find the results of your efforts in /var/nst/wuiout/wireshark. Now here’s where the cool comes in. CloudShark (yep, Wireshark in the cloud) allows you to “secure, share, and analyze capture files anywhere, on any device” via either cloudshark.org or a CloudShark appliance. Please note that capture files uploaded to cloudshark.org are not secured by default and can be viewed by anyone who knows the correct URL. You’ll need an appliance or CloudShark Enterprise to secure and manage captures. That aside the premise of CloudShark is appealing and NST integrates CloudShark directly. From the Tools menu select Network Widgets then CloudShark Upload Manager. I’d already upload malicious.pcap as seen in Figure 3.

Figure 3: CloudShark tightly integrated with NST
Users need only click on View Network Packet Captures in the upload manager and they’ll be directed right to the CloudShark instance of their uploaded capture as seen in Figure 4.

Figure 4: Capture results displayed via CloudShark
Many of the features you’d expect from a local instance of Wireshark are available to the analyst, including graphs, conversations, protocol decodes, and follow stream.

NST also includes the Network Interface Bandwidth Monitor. Select Network-> Monitors -> Network Interface Bandwidth Monitor. A bandwidth monitor for any interface present on your NST instance will be available to you (eth0 and lo on my VM) as seen in Figure 5.

Figure 5: NST’s Network Interface Bandwidth Monitor
You can see the +100 kbps spikes I generated against eth0 with a quick NMAP scan as an example.

NST’s geolocation capabilities are many, but be sure to setup the NST system to geolocate data first. I uploaded a multiple host PCAP (P2P traffic) via Network Packet Capture Manager, clicked the A (attach) button under Action and was them redirected back to Network -> Protocol Analyzers -> Single-Tap Network Packet Capture.I then chose to use the Text-Based Protocol Analyzer Decode option as described on the NST Wikiand clicked the Hosts – Google Mapsbutton. This particular capture gave NST a lot of work to do as it includes thousands of IPs but the resulting geolocated visualization as seen in Figure 6is well worth it.

Figure 6: P2P bot visually geolocated via NST
If we had page space available to show you the whole world you’d see that the entire globe is represented by this bot, but I’m only showing you North America and Europe.

As discussed in recent OSINT-related toolsmiths, there’s even an NST OSINT feature called theHarvester found under Security -> Information Search -> theHarvester. Information gathering with theHarvester includes e-mail accounts, user names, hostnames, and domains from different public internet sources.
So many features, so little time. Pick an item from the menu and drill in. There’s a ton of documentation under the Docs menu too, including the NST Wiki, so you have no excuses not to jump in head first.

In Conclusion

NST is one of those offerings where the few pages dedicated to it in toolsmith don’t do it justice. NST is incredibly feature rich, and literally invites the user to explore while the hours sneak by unnoticed. The NST WUI has created a learning environment I will be incorporating into my network security analysis teaching regimens. New to network security analysis or a salty old hand, NST is a worthy addition to your tool collection.
Ping me via email if you have questions (russ at holisticinfosec dot org).
Cheers…until next month.

Acknowledgements

Paul Blankenbaker and Ron Henderson, NST project leads

toolsmith: Arachni - Web Application Security Scanner

$
0
0


Part 1 of 2 - Web Application Security Flaw Discovery and Prevention


Prerequisites/dependencies
Ruby 1.9.2 or higher in any *nix environment

Introduction
This month’s issue kicks off a two part series on web application security flaw discovery and prevention, beginning with Arachni. As this month’s topic is another case of mailing lists facilitating great toolsmith topics, I’ll begin this month by recommending a few you should join if you haven’t already. The Web Application Security Consortium mailing list is a must, as are the SecurityFocus lists. I favor their Penetration Testing and Web Application Security lists but they have many others as well. As you can imagine, these two make sense for me given focuses on web application security and penetration testing, and it was via SecurityFocus that I received news of the latest release of Arachni. Arachni is a high-performance, modular, open source web application security scanning framework written in Ruby. It was refreshing to discover a web app scanner I had not yet tested. I spend a lot of time with the likes of Burp, ZAP, and Watobo but strongly advocate expanding the arsenal.
Arachni’s developer/creator is Tasos "Zapotek" Laskos, who kindly provided details on this rapidly maturing tool and project.
Via email, Tasos indicated that to date, Arachni's role has been that of an experiment/learning-exercise hybrid, mainly focused on doing things a little bit differently. He’s glad to say that the fundamental project goals have been achieved; Arachni is fast, relatively simple, quite accurate, open source and quite flexible in the ways which it can be deployed. In addition, as of late, stability and testing have been given top priority in order to ensure that the framework won't exhibit performance degradation as the code-base expands.
With a strong foundation laid and a clear road map, future plans for Arachni include pushing the envelope where version 0.4.2 include improved distributed, high-performance scan features such as the new, distributed crawler(under current development), and a new, cleaner, more stable and attractive Web User Interface, as well as general code clean-up.
Version 0.5 is where a lot of interesting work will take place as the Arachni team will be attempting to break some new ground with native DOM and JavaScript support, with the intent of allowing a depth/level of analysis beyond what's generally possible today, from either open source or commercial systems. According to Tasos, most, if not all, current scanners rely on external browser engines to perform their duties bringing with them a few penalties (performance hits, loss of control, limited inspection capabilities, design compromises, etc.), which Arachni will be able to avoid. This kind of functionality, especially from an open and flexible system, will be greatly beneficial to web application testing in general, and not just in a security-related context.

Arachni success stories include incredibly cool features such as WAF Realtime Virtual Patching. At OWASP AppSec DC 2012, Trustwave Spider Lab’s Ryan Barnett discussed the concept of dynamic application scanning testing (DAST) exporting data that is then imported into a web application firewall (WAF) for targeted remediation. In addition to stating that the Arachni scanner is an “absolutely awesome web application scanner framework” Ryan describes how to integrate export data from Arachni with ModSecurity, the WAF for which he is OWASP ModSecurity Core Rule Set (CRS) project leader. Take note here as next month in toolsmith we’re going to discuss ModSecurity for IIS as part two of this series and will follow Ryan’s principles for DAST to WAF.   
Other Arachni successes include highly-customized scripted audits and easy incorporation into testing platforms (by virtue of its distributed features).  Tasos has received a lot of positive feedback and has been pleasantly surprised there has not been one unsatisfied user, even in the Arachni's early, immature phases. Many Arachni users end up doing so out of frustration with the currently available tools and are quite happy with the results after giving Arachni a try given that Arachni gives users a decent alternative while simplifying web application security assessment tasks.
Arachni benefits from excellent documentation and support via its wiki, be sure to give a good once over before beginning installation and use.

Installing Arachni

On an Ubuntu 12.10 instance, I first made sure I had all dependencies met via sudo apt-get install build-essential libxml2-dev libxslt1-dev libcurl4-openssl-dev libsqlite3-dev libyaml-dev zlib1g-dev ruby1.9.1-dev ruby1.9.1.
For developer’s sake, this includes Gem support so thereafter one need only issue sudo gem install arachni to install Arachni. However, the preferred method is use of the appropriate system packages from the latest downloads page.
While Arachni features robust CLI use, for presentation’s sake we’ll describe Arachni use with the Web UI. Start it via arachni_web_autostartwhich will initiate a Dispatcher and the UI server. The last step is to point your browser to http://localhost:4567, accept the default settings and begin use.

Arachni in use

Of interest as you begin Arachni use is the dispatcher which spawns RPC instances and allows you to attach to, pause, resume, and shutdown Arachni instances. This is extremely important for users who wish to configure Arachni instances in a high performance grid (think a web application security scanning cluster with a master and slave configuration). Per the wiki, “this allows scan-time to be severely decreased, by as much as n times less under ideal circumstances, where nequals the number of running instances.”   
You can configure Arachni’s web UI to run under SSL and provide HTTP Basic authentication if you wish to lock use down. Refer to the wiki entry for the web user interface for more details.
Before beginning a simple scan (one Dispatcher), let’s quickly review Arachni’s modules and plugins. Each has a tab in Arachni’s primary UI view. The  45 modules are divided into Audit (22) and Recon (23) options where the audit modules actively test the web application via inputs such as parameters, forms, cookies and headers while the recon modules passively test the web application, focusing on server configuration, responses and specific directories and files. I particularly like the additional SSN and credit card number disclosure modules as they are helpful for OSINT, as well as the Backdoor module, which looks to determine if the web application you’re assessing is already owned. Of note from the Audit options is the Trainer module that probes all inputs of a given page in order to uncover new input vectors and trains Arachni by analyzing the server responses. Arachni modules are all enabled by default. Arachni plugins offer preconfigured auto-logins (great when spidering), proxy settings, and notification options along with some pending plugins supported in the CLI version but not yet ready for the Web UI as of v.0.4.1.1
To start a scan, navigate to the Start a scan tab and confirm that a Dispatcher is running. You should see the likes of @localhost:7331 (host and port) along with number of running scans, as well as RAM and CPU usage. Then paste a URL into the URL form, and select Launch Scan as seen in Figure 1
 
Figure 1: Launching an Arachni scan

While the scan is running you can monitor the Dispatcher status via the Dispatchers tab as seen in Figure 2.

Figure 2: Arachni Dispatcher status
From the Dispatchers view you can choose to Attachto the running Instance (there will be multiples if you’ve configured a high performance grid) which will give a real-time view to the scan statistics, percentage of completion for the running instance, scanner output, and results for findings discovered as seen in Figure 3. Dispatchers provide Instances, Instances perform the scans.

Figure 3: Arachni scan status
Once the scan is complete, as you might imagine, the completed results report will be available to you in the Reports tab. As an example I chose the HTML output but realize that you can also select JSON, text, YAML, and XML as well as binary output such as Metareport, Marshal report, and even Arachni Framework Reporting. Figure 4 represents the HTML-based results of a scan against NOWASP Mutillidae.

Figure 4: HTML Arachni results
Even the reports are feature-rich with a summary tab with graphs and issues, remedial guidance, plugin results, along with a sitemap and configuration settings.
The results are accurate too; in my preliminary testing I found very few false positives. When Arachni isn’t definitive about results, it even goes so far as to label the result “untrusted (and may in fact be false positives) because at the time they were identified the server was exhibiting some kind of anomalous behavior or there was 3rd part interference (like network latency for example).” Nice, I love truth and transparency in my test results.
I am really excited to see Arachni work at scale. I intend to test it very broadly on large applications using a high performance grid. This is definitely one project I’ll keep squarely on my radar screen as it matures through its 0.4.2 and 0.5 releases.

In Conclusion

Join us again next month as we resume this discussion when take Arachni results and leverage them for Realtime Virtual Patching with ModSecurity for IIS. By then I will have tested Arachni’s clustering capabilities as well so we should have some real benefit to look forward to next month. Please feel free to seek support via the support portal, file a bug report via the issue tracker, or to reach out to Tasos via Twitter or email as he looks forward to feedback and feature requests.
Ping me via email if you have questions (russ at holisticinfosec dot org).
Cheers…until next month.

Acknowledgements

Tasos "Zapotek" Laskos, Arachni project lead

CTIN Digital Forensics Conference - No fluff, all forensics

$
0
0
For those of you in the Seattle area or willing to travel who are interested in digital forensics there is a great opportunity to learn and socialize coming up in March.
The CTIN Digital Forensics Conference will be March 13 though 15, 2013 at the Hilton Seattle Airport & Conference Center. CTIN, the Computer Technology Investigators Network, is non-profit, free membership organization comprised of public and private sector computer forensic examiners and investigators focused on the areas of high-tech security, investigation, and prosecution of high-tech crimes for both private and public sector.

Topics slated for the conference agenda are many, with great speakers to discuss them in depth:
Windows Time Stamp Forensics, Incident Response Procedures, Tracking USB Devices, Timeline Analysis with Encase, Internet Forensics, Placing the Suspect Behind the Keyboard, Social Network Investigations, Triage, Live CDs (WinFE & Linux)
F-Response and Intella, Lab - Hard drive repair, Mobile Device Forensics, Windows 7/8 Forensics
Child Pornography, Legal Update, Counter-forensics, Linux Forensics, X-Ways Forensics
Expert Testimony, ProDiscover, Live Memory Forensics, Encase, Open Source Forensic Tools
Cell Phone Tower Analysis, Mac Forensics, Registry Forensics, Malware Analysis, iPhone/iPad/other Apple products, Imaging Workshop, Paraben Forensics, Virtualization Forensics


Register before 1 DEC 2012 for $295, and $350 thereafter.

While you don't have to be a CTIN member to attend I strongly advocate your joining and supporting CTIN.

toolsmith: ModSecurity for IIS

$
0
0


Part 2 of 2 - Web Application Security Flaw Discovery and Prevention

Prerequisites/dependencies
Windows OS with IIS (Win2k8 used for this article)
SQL Server Express 2004 SP4 and Management Studio Express for vulnerable web app
.NET Framework 4.0 for ModSecurity IIS

Introduction

December’s issue continues where we left off in November with part two in our series on web application security flaw discovery and prevention. In November we discussed Arachni, the high-performance, modular, open source web application security scanning framework. This month we’ll follow the logical work flow from Arachni’s distributed, high-performance scan results to how to use the findings as part of mitigation practices. One of Arachni’s related features is WAF Realtime Virtual Patching.
Trustwave Spider Lab’s Ryan Barnett has discussed the concept of dynamic application scanning testing(DAST) data that can be imported into a web application firewall (WAF) for targeted remediation. This discussion included integrating export data from Arachni into ModSecurity, the cross–platform, open source WAF for which he is the OWASP ModSecurity Core Rule Set (CRS) project leader. I reached out to Ryan for his feedback with particular attention to ModSecurity for IIS, Microsoft’s web server.
He indicated that WAF technology has gained traction as a critical component of protecting live web applications for a number of key reasons, including:
1)      Gaining insight into HTTP transactional data that is not provided by default web server logging
2)      Utilizing Virtual Patching to quickly remediate identified vulnerabilities
3)      Addressing PCI DSS Requirement 6.6
The ModSecurity project is just now a decade old (first released in November 2002), has matured significantly over the years, and is the most widely deployed WAF in existence protecting millions of websites. “Until recently, ModSecurity was only available as an Apache web server module. That changed, however, this past summer when Trustwave collaborated with the Microsoft Security Response Center (MSRC) to bring the ModSecurity WAF to the both the Internet Information Services (IIS) and nginx web server platforms.  With support for these platforms, ModSecurity now runs on approximately 85% of internet web servers.” 
Among the features that make ModSecurity so popular, there are a few key capabilities that make it extremely useful:
It has an extensive audit engine which allows the user to capture the full inbound and outbound HTTP data.  This is not only useful when reviewing attack data but is also extremely valuable for web server administrators who need to trouble-shoot errors.
·         It includes a powerful, event-driven rules language which allows the user to create very specific and accurate filters to detect web-based attacks and vulnerabilities.
·         It includes an advanced Lua API which provides the user with a full-blown scripting language to define complex logic for attack and vulnerability mitigation.
·         It also includes the capability to manipulate live transactional data.  This can be used for a variety of security purposes including setting hacker traps, implementing anti-CSRF tokens, or Cryptographic HASH tokens to prevent data manipulation.
In short, Ryan states that ModSecurity is extremely powerful and provides a very flexible web application defensive framework that allows organizations to protect their web applications and quickly respond to new threats.
I also sought details from Greg Wroblewski, Microsoft’s lead developer for ModSecurity IIS.
“As ModSecurity was originally developed as an Apache web server module, it was technically challenging to bring together two very different architectures. The team managed to accomplish that by creating a thin layer abstracting ModSecurity for Apache from the actual server API. During the development process it turned out that the new layer is flexible enough to create another ModSecurity port for the nginx web server. In the end, the security community received a new cross-platform firewall, available for the three most widely used web servers.
The current ModSecurity development process (still open, recently migrated to GitHub) preserves compatibility of features between three ported versions. For the IIS version, only features that rely on specific web server behavior show functional differences from the Apache version, while the nginx version currently lacks some of the core features (like response scanning and content injection) due to limited extensibility of the server. Most ModSecurity configuration files can be used without any modifications between Apache and IIS servers. The upcoming release of the RTM version for IIS will include a sample of ModSecurity OWASP Core Rule Set in the installer.

Installing ModSecurity for IIS

In order to test the full functionality of ModSecurity for IIS I needed to create an intentionally vulnerable web application and did so following guidelines provided by Metasploit Unleashed. The author wrote these guidelines for Windows XP SP2, I chose Windows Server 2008 just to be contrarian. I first established a Win2k8 virtual machine, enabled the IIS role, downloaded and installed SQL Server 2005 Express SP4, .NET Framework 4.0, as well as SQL Server 2005 Management Studio Express, then downloaded and the ModSecurity IIS 2.7.1 installer. We’ll configure ModSecurity IIS after building our vulnerable application. When configuring SQL Server 2005 Express ensure you enable SQL Server Authentication, and set the password to something you’ll use in the connection string established in Web.config. I used p@ssw0rd1 to meet required complexity. JNote: It’s “easier” to build a vulnerable application using SQL Server 2005 Express rather than 2008 or later; for time’s sake and reduced troubleshooting just work with 2005. We’re in test mode here, not production. That said, remember, you’re building this application to be vulnerable by design. Conduct this activity only in a virtual environment and do not expose it to the Internet. Follow the Metasploit guidelines carefully but remember to establish a proper connection string in the Web.config (line 4) and build it from this sample I’m hosting for you rather than the one included with the guidelines. As an example, I needed to establish my actual server name rather than localhost, I defined my database name as crapapp instead of WebApp per the guidelines, and used p@ssw0rd1 instead of password1 as described:
I also utilized configurations recommended for the pending ModSecurity IIS install so go with my version.
Once you’re finished with your vulnerable application build you should browse to http://localhost and first pass credentials that you know will fail to ensure database connectivity. Then test one of the credential pairs established in the users table, admin/s3cr3tas an example. If all has gone according to plan you should be treated to a successful login message as seen in Figure 1.

FIGURE 1: A successful login to CrapApp
ModSecurity IIS installation details are available via TechNet but I’ll walk you through a bit of it to help overcome some of the tuning issues I ran into. Make sure you have the full version of .NET 4.0 installed and patch it in full before you execute the ModSecurity IIS installer you downloaded earlier.
Download the ModSecurity OWASP Core Rule Set (CRS) and as a starting point copy the files from the base_rules to the crs directory you create in C:\inetpub\wwwroot. Also put the test.conffile I’m also hosting for you in C:\inetpub\wwwroot. This will call the just-mentioned ModSecurity OWASP Core Rule Set (CRS) that Ryan maintains and also allow you to drop any custom rules you may wish to create right in test.conf.
There are a few elements to be comfortable with here. Watch the Windows Application logs via Event Viewer to both debug any errors you receive as well as ModSecurity alerts once properly configured. I’m hopeful that the debugging time I spent will help save you a few hours, but watch those logs regardless. Also make regular use of the Internet Information Services (IIS) Manger to refresh the DefaultAppPool under Application Pools as well as restart the IIS instance after you make config changes. Finally, this experimental installation intended to help get you started is running in active mode versus passive. It will both detect and block what the CRS notes as malicious. As such, you’ll want to initially comment out all the HTTP Policy rules in order to play with the CrapApp we built above. To do so, open modsecurity_crs_30_http_policy.conf in the crs directory and comment out all lines that start with SecRule. Again, we’re in experiment mode here. Don’t deploy ModSecurity in production with the SecDefaultActiondirective set to "block" without a great deal of testing in passive mode first or you’ll likely blackhole known good traffic.

Using ModSecurity and virtual patching to protect applications

Now that we’re fully configured, I’ll show you the results of three basic detections then close with a bit of virtual patching for your automated web application protection pleasure. Figure 2 is a mashup of a login in attempt via our CrapApp with a path traversal attack and the resulting detection and block as noted in the Windows Application log.

FIGURE 2: Path traversal attack against CrapApp denied
Similarly, a simple SQL injection such as ‘1=1-- against the same form field results in the following Application log entry snippet:
[msg "SQL Injection Attack: Common Injection Testing Detected"] [data "Matched Data: ' found within ARGS:txtLogin: '1=1--"] [severity "CRITICAL"] [ver "OWASP_CRS/2.2.6"] [maturity "9"] [accuracy "8"] [tag "OWASP_CRS/WEB_ATTACK/SQL_INJECTION"] [tag "WASCTC/WASC-19"] [tag "OWASP_TOP_10/A1"] [tag "OWASP_AppSensor/CIE1"] [tag "PCI/6.5.2"]

Note the various tags including a match to the appropriate OWASP Top 10 entry as a well as the relevant section of the PCI DSS.
Ditto if we pop in a script tag via the txtLogin parameter:
[data "Matched Data: "] [ver "OWASP_CRS/2.2.6"] [maturity "8"] [accuracy "8"] [tag "OWASP_CRS/WEB_ATTACK/XSS"] [tag "WASCTC/WASC-8"] [tag "WASCTC/WASC-22"] [tag "OWASP_TOP_10/A2"] [tag "OWASP_AppSensor/IE1"] [tag "PCI/6.5.1"]
    
Finally, we’re ready to connect our Arachni activities in Part 1 of this campaign to our efforts with ModSecurity IIS. There are a couple of ways to look at virtual patching as amply described by Ryan. His latest focus has been more on dynamic application scanning testing as actually triggered via ModSecurity. There is now Lua scripting that integrates ModSecurity and Arachni over RPC where a specific signature hit from ModSecurity will contact the Arachni service and kick off a targeted scan. At last check this code was still experimental and likely to be challenging with the IIS version of ModSecurity. That said we can direct our focus in the opposite direction to utilize Ryan’s automated virtual patching script, arachni2modsec.pl, where we gather Arachi scan results and automatically convert the XML export into rules for ModSecurity. These custom rules will then protect the vulnerabilities discovered by Arachni while you haggle with the developers over how long it’s going to take them to actually fix the code.
To test this functionality I scanned the CrapApp from Arachni instance on the Ubuntu VM I built for last month’s article. I also set the SecDefaultActiondirective set to "pass" in my test.conffile to ensure the scanner is not blocked while it discovers vulnerabilities. Currently the arachni2modsec.pl script writes rules specifically for SQL Injection, Cross-site Scripting, Remote File Inclusion, Local File Inclusion, and HTTP Response Splitting. The process is simple; assuming the results file is results.xml, arachni2modsec.pl –f results.xml will create modsecurity_crs_48_virtual_patches.conf. On my ModSecurity IIS VM I’d then copy modsecurity_crs_48_virtual_patches.conf into the C:\inetpub\wwwroot\crs directory and refresh the DefaultAppPool. Figure 3 gives you an idea of the resulting rule.  

FIGURE 3: arachni2modsec script creates rule for ModSecurity IIS
Note how the rule closely resembles the alert spawned when I passed the simple SQL injection attack to CrapApp earlier in the article. Great stuff, right?

In Conclusion

What a great way to wrap up 2012 with the conclusion of this two-part series on Web Application Security Flaw Discovery and Prevention. I’m thrilled with the performance of ModSecurity for IIS and really applaud Ryan and Greg for their efforts. There are a number of instances where I intend to utilize the ModSecurity port for IIS and will share feedback as I gather data. Please let me know how it’s working for you as well should you choose to experiment and/or deploy.
Good luck and Merry Christmas.
Stay tuned to vote for the 2012 Toolsmith Tool of the year starting December 15th.
Ping me via email if you have questions (russ at holisticinfosec dot org).
Cheers…until next month.

Acknowledgements

Ryan Barnett, Trustwave Spider Labs, Security Researcher Lead
Greg Wroblewski, Microsoft, Senior Security Developer

Choose the 2012 Toolsmith Tool of the Year

$
0
0
Merry Christmas and Happy New Year! It's that time again.
Please vote below to choose the best of 2012, the 2012 Toolsmith Tool of the Year.
We covered some outstanding information security-related tools in ISSA Journal's toolsmith during 2012; which one do you believe is the best?
I appreciate you taking the time to make your choice.
Review all 2012 articles here for a refresher on any of the tools listed in the survey.
You can vote through January 31, 2013. Results will be announced February 1, 2013

Create your free online surveys with SurveyMonkey, the world's leading questionnaire tool.

toolsmith: Violent Python - A Book Review Applied to Security Analytics

$
0
0


Prerequisites/dependencies
Python interpreter
BackTrack 5 R3 is ideally suited to make immediate use of Violent Python scripts

Introduction
Happy New Year and congratulations on surviving the end of the world as we know it (nyah, nyah Mayan calendar). Hard to imagine we’re starting yet another year already; 2012 simply screamed by. Be sure to visit the HolisticInfoSec blog post for the 2012 Toolsmith Tool of the Year and vote for your favorite tool of 2012.
I thought I’d start off 2013 with a bit of a departure from the norm. Herein is the first treatment of a book as a tool where the content and associated code can be utilized to perform duties specific to the information security practitioner. I can think of no better book with which to initiate this approach than TJ O’Connor’s Violent Python, A Cookbook for Hackers, Forensic Analysts, Penetration Testers, and Security Engineers. Yes, this implies that you should buy the book; trust me, it’s worth every dime of the $34. Better still, TJ has donated all his proceeds to the Wounded Warrior Project. That said, I’ll post TJ’s three scripts we’ll discuss here so as to whet your appetite. I’ve had the distinct pleasure of working with TJ as part of the SANS Technical Institute’s graduate program where we, along with Beth Binde, wrote AssessingOutbound Traffic to Uncover Advanced Persistent Threat. I’ve known some extremely bright capable information security experts in my day and I can comfortably say TJ is hands down amongst the very best of that small group. As part of his service as an officer in the U.S. Army (hooah) TJ has served as the course director for both computer exploitation and digital forensics at the US Military Academy and as an communications officer supporting tactical communications. His book maps nicely to a philosophy I embrace and incorporate in the workplace. Security monitoring, incident response (and forensics), and attack and penetration testing are the three pillars of security analytics, each feeding and contributing the others in close cooperation. As an example, capable security monitoring inevitably leads to a need for incident response, and after mitigation and remediation have ensued, penetration testing is key to validating that corrective measures were successful, which in turn helps the monitoring team assess and tune detection and alerting logic. Security analytics: the information security circle of life J.
How does a book such as TJ’s Violent Python reverberate with this philosophy? How about entire chapters dedicated to each of the above mentioned pillars, including Python scripts for network traffic analysis (monitoring), forensic investigations (IR), as well as web recon and penetration testing. We’ll explore one script from each discipline shortly, but not before hearing directly from the author:
“In a lot of ways writing a book is a cathartic experience where you capture a lot of things you have done. All too often I'm writing scripts to achieve an immediate effect and then I throw away the script. For me the book was an opportunity to capture a lot of those small projects I've done and simplify the learning curve for others. My favorite example was the UAV takeover in the book. We show how to take over any really Ad-Hoc WiFi toys in under 70 lines of code. A few friends joked that I couldn't write a script in under 100 lines to crash a UAV. This was my chance to provide them a working concept and it worked! Unfortunately it left my daughter with a toy UAV cracked into several pieces as I refined the code. From a defensive standpoint, understanding a scripting language is absolutely essential in my opinion. The ability to parse data such as DNS traffic or geo-locate IP traffic (both shown in the book) can give a great deal of visibility. Forensics tools are great but the ability to build your own are even better. We show how to write tools to parse out iPhone backups for data and scrape for specific objects. The initial feedback from the book has been overwhelming and I've really enjoyed hearing positive feedback. No future plans right now but a good friend of mine has mentioned writing "Violent Powershell" so we'll see where that goes.”    
Violent Pythonprovides readers the basis for scripts to attack network services, analyze digital artifacts, investigate network traffic for malicious activity, and data-mine social media, not to mention numerous other activities. This is a must-read book that includes a companion site with all the code discussed. Let’s take a closer look at three of these efficient and useful Python scripts.

Making Use of Violent Python

As noted above, I’ve posted the three scripts discussed in this section, along with the PCAP and PDF (malicious) discussed on my website. Email or Tweet for the zip passwords.
TJ suggests utilizing a BackTrack distribution given that many of the dependencies and libraries required to use the scripts in this book are inherent to BackTrack. We’ll follow suit on a BackTrack 5 R3 virtual machine. Before beginning, we’ll need to set up a few prerequisites. Execute easy_install pyPDF python-nmap pygeoip mechanize BeautifulSoup4 at the BT5R3 root prompt. This will install pygeoip as needed for our first exercise. I’m going to conduct these exercises a bit out of chapter sequence in order to follow the security analytics lifecycle starting with monitoring. This drops us first into Chapter 4 where we’ll utilize MaxMind’s GeoLiteCity to map IP addresses to cities. In order to do so, you’ll need to set up GeoLiteCity on BackTrack or your preferred system with the following steps:
1.  mkdir /opt/GeoIP
2.  cd /opt/GeoIP/
3.  wget http://geolite.maxmind.com/download/geoip/database/GeoLiteCity.dat.gz
4.  gunzip GeoLiteCity.dat.gz
You’ll then need to edit line 7 of geoPrint.py to read gi = pygeoip.GeoIP('/opt/GeoIP/GeoLiteCity.dat')or download the updated copy of the script I’ve posted for you.

I’ve created a partially arbitrary scenario for you with which to walk through the security analytics lifecycle using Violent Python. To do so I’ll refer to what was, in 2009 an actual malicious domain, used to host shellcode for PDF-based malware attacks. I grabbed a malicious PDF sample from Contagio, an excellent sample resource. The IP address I associate with this domain is where I am taking creative liberties as the domain we’ll discuss, ax19.cn, no longer exists, and there is no record of what its IP address was when it was in use. The PCAP we’ll use here is one I edited with bittwiste to arbitrarily introduce a suspect Chinese IP address to what was originally a packet capture from a machine compromised by Win32.Banload.MC. I’ve shared this PCAP and the PDF as mentioned above so you can try the Python scripts with them for yourself.  
In this scenario, your analysis machine is Linux only. Just you, a Python interpreter, and a shell; no fuss, no muss.
As we’re starting in the monitoring phase, imagine you have a network for which the traffic baseline is well understood. You can assert, from one particular high value VLAN, that at no time should you ever see traffic bound for China.  Your netflow monitoring for that VLAN is showing far more egress traffic bound for IP space that is not on your approved list established from learned baselines. You initiate a real-time packet capture to confirm. Capture (suspect.pcap) in hand, you’d like to validate that the host is indeed conversing with an IP address in China. Violent Python’s geoPrint.py script is a great place to start as it leverages the above-mentioned GeoLiteCity data from MaxMind along with the PyGeoIP library from Jennifer Ennis and dpkt. Execute python geoPrint.py -p suspect.pcap and you’ll see results as noted in Figure 1.

Figure 1: geoPrint.py confirms Chinese takeout
Your internal host (RFC 1918, and thus unregistered) with IP address 192.168.248.114 is clearly conversing with 116.254.188.24 in Beijing. Uh-oh.
Your team now moves into incident response mode and seizes the host in question. You interview the system’s user who indicates they received an email what the user thought was a legitimate help desk notification to read a new policy. The email had an attached PDF file which the user downloaded and opened. Your suspicions are heightened, as such you grab a copy of the PDF and head back to your analysis workstation. You’re interested to see if there is any interesting metadata in the PDF that might help further your investigation. You refer to Chapter 3 of Violent Python which discusses Forensic Investigations with Python. The pdfRead.pyscript incorporates the PyPDF library which allows you to extract PDF document information (metadata) in addition to other capabilities. Execute python pdfRead.py -F suspect.pdf and dump the metadata as seen in Figure 2.

Figure 2: pdfRead.py dumps suspect PDF metadata
The author reference is a standout for you; from a workstation with a browser you search “Zeon Technical Publications” and find reference to it on VirusTotal and JSunpack; these results along with a quick MD5sum hash match indicate that this PDF is clearly malicious. The JSunpack reference indicates that shellcode phones home to www.ax19.cn (see Figure 3), a domain for which you’d now like to learn more.

Figure 3: JSunpack confirms an evil PDF
You could have sought anonymity to conduct the above mentioned search, which lead us to the third pillar of our security analytics lifecycle. This third phase here includes web recon as discussed in Chapter 6 of Violent Python, a common step in the attack and penetration testing discipline, to see what more we can learn about this malicious domain. As we often seek anonymity during the recon phase, Violent Python allows you maintain a bit of stealth by leveraging the deprecated Google API against which a few queries a day can still be executed. The newer API requires a developer’s key which one can easily argue is not anonymous. Executing python anonGoogle.py -k 'www.ax19.cn'will return yet another validating result as seen in Figure 4.

Figure 4: anonGoogle matches ax19.cn to malicious activity
With seven rich chapters of Python goodness, TJ’s Violent Pythonrepresents a golden opportunity to expanding your security analytics horizons. There is so much to learn from here while accentuating your use of Python in your information security practice.

In Conclusion

I’m hopeful this slightly different approach to toolsmith was useful for you this month. I’m looking to shake things up a bit here in 2013 and am certainly open to suggestions you may have regarding ideas and approaches to doing so. Violent Pythonwas a great read for me and a pleasure to put to use for both this article as well as in my personal tool box. I’m certain you’ll find this book equally useful.
Ping me via email if you have questions (russ at holisticinfosec dot org).
Cheers…until next month.

Acknowledgements

TJ O’Connor, Violent Python author
Mila Parkour, Contagio

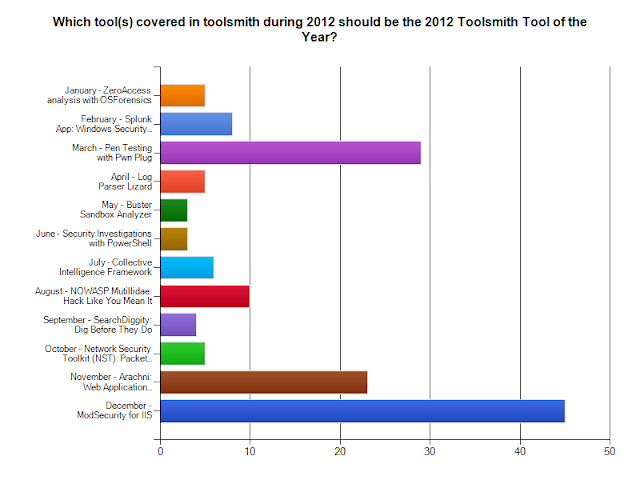
2012 Toolsmith Tool of the Year: ModSecurity for IIS

$
0
0
Congratulations to Ryan Barnett of Trustwave and Greg Wroblewski of Microsoft.
ModSecurity for IIS is the 2012 Toolsmith Tool of the Year.
ModSecurity for IIS finished with 35.4% of the vote, while the Pwnie ExpressPwn Plug came in second with 22.8%, and the Arachni Web Application Security Scanner came in third with 18.1% of the votes.

As ModSecurity is best utilized with the OWASP ModSecurity Core Rule Set (CRS), I will make a $50 donation to the CRS Project. I strongly advocate for your supporting this project as well; any amount will help.

Congratulations and thank you to all of this year's participants; we'll have another great round in 2013.


toolsmith: Social-Engineer Toolkit (SET) - Pwning the Person

$
0
0


Prerequisites/dependencies
Python interpreter
Metasploit
BackTrack 5 R3 also includes SET


Introduction
My first discussion of  Dave Kennedy’s (@dave_rel1k) Social-Engineer Toolkit (SET) came during exploration of the Pwnie Express PwnPlug Elite for March 2012’s toolsmith.  It was there I talked about the Site Cloner feature found under Website Attack Vectors and Credential Harvesting Attack Methods. Unless you’ve been hiding your head in the sand (“if I can’t see the security problem, then it doesn’t exist”) you’re likely aware that targeted attacks such as spear phishing, whaling, and social engineering in general are prevalent. Additionally, penetration testing teams will inevitably fall back on this tactic if it’s left in scope for one reason: it always works. SET serves to increase awareness for all the possible social engineering vectors; trust me, it is useful for striking much fear in the hearts of executives and senior leaders at client, enterprise, and military briefings. It’s also useful for really understanding the attacker mindset. With distributions such at BackTrack including SET, fully configured and ready to go, it’s an absolute no brainer to add to your awareness briefing and/or pen-testing regimen.   
Dave is the affable and dynamic CEO of TrustedSec (@trustedsec) and, as SET’s creator, describes it in his own words:

The Social-Engineer Toolkit has been an amazing ride and the support for the community has been great. When I first started the toolkit, the main purpose was to help out on social engineering gigs but it's completely changed to an entire framework for social-engineering and the community. SET has progressed from a simple set of python commands and web servers to a full suite of attacks that can be used for a number of occasions. With the new version of SET that I'm working on, I want to continue to add customizations to the toolkit where it allows you to utilize the multi attack vector and utilize it in a staged approach that’s all customized. When I'm doing social-engineering gigs, I change my pretext (attack) on a regular basis. Currently, I custom code some of my options such as credential harvester first then followed by the Java Applet. I want to bring these functionalities to SET and continue forward with the ability to change the way the attack works based on the situation you need. I use my real life social-engineering experiences with SET to improve it, if you have any ideas always email me to add features!

Be sure to catch Dave’s presentation videos from DEFCON and DerbyCom, amongst others, on the TrustedSec SET page.

Quick installation notes

It’s easiest to run SET from BackTrack. Boot to it via USB or optical media, or run it as a virtual machine. Navigate to Applications | BackTrack | Exploitation Tools | Social Engineering Tools| Social Engineering Toolkit | set and you’re off to the races.
Alternatively, on any system where you have a Python interpreter and a Git (version control/source code management) client, you can have SET up and running in minutes. Ideally, the system you choose to run SET from should have Metasploit configured too as SET calls certain Metasploit payloads, but it’s not a hard, fast dependency. If no Metasploit, many SET features won’t work, simple. But if you plan to go full goose bozo…you catch my drift.
I installed set on Ubuntu 12.10 as well as Windows 7 64-bit as simply as running git clone https://github.com/trustedsec/social-engineer-toolkit/ set/ from a Bash shell (Ubuntu) or Git Shell (Windows). Note:if you’re running anti-malware on a Windows system where SET is to be installed, be sure to build an exclusion for the SET path or AV will eat some key exploits (six to be exact). A total bonus for you and I occurred as I wrote this. On 24 JAN, Dave released version 4.4.1 of SET, codename “The Goat.” If you read the CHANGES file in SET’s readme directory you’ll learn that this release includes some significant Java Applet updates, encoding and encryption functionality enhancements, and improvements for multi_pyinjector. I updated my BackTrack 5 R3 instance to SET 4.4.1 by changing directory to /pentest/exploits, issuing mv set set_back, then the above mentioned git command. Almost instantly, a shiny new SET ready for a few laps around the track.  Your SET instance needs to be available via the Internet for remote targets to phone home to, or exposed to your local network for enterprise customers. You’ll be presenting a variety of offerings to your intended victims via the SET server IP or domain name.

SET unleashed

Now to rapid fire some wonderful social engineering opportunities at you. How often do you or someone you know wander up to a sign or stop at a web page with a QR code and just automatically scan it with your smart phone? What if I want to send you to any site of my choosing? I’ll simply generate a QR code with the URL destination I want to direct you to. If I’m a really bad human being that site might be offering up the Blackhole exploit kit or something similar. Alternatively, as SET recommends when you choose this module, “when you have the QRCode generated, select an additional attack vector within SET and deploy the QRCode to your victim. For example, generate a QRCode of the SET Java Applet and send the QRCode via a mailer.”
From the SET menu, choose 1) Social-Engineering Attacks, then 9) QRCode Generator Attack Vector, and enter your desired destination URL. SET will generate the QR code and write it to /pentest/exploits/set/reports-qr_attack.pngas seen in Figure 1.

Figure 1: QR Code attack generated by SET
From SET’s main menu, 3)Third Party Modules will offer you the RATTE Java Applet Attack (Remote Administration Tool Tommy Edition), and 2) Website Attack Vectors | 1) Java Applet Attack Method will provide templates or site cloning with which you can delivery one heck of a punch via the QR code vector.

Our good friend Java is rife for social engineer targeting opportunities and SET offers mayhem aplenty to capitalize on this fact.  Here’s a sequence to follow from the SET menu:
1) Social-Engineering Attacks | 2) Website Attack Vectors | 1) Java Applet Attack Method | 1) Web Templates

Answer yes or no to NAT/Port Forwarding, enter your SET server IP or hostname, and select 1 for the Java Required template as seen in Figure 2.

Figure 2: Java applet prepped for deployment
You’ll then need to choose what payload you wish to generate. Methinks ye olde Windows Reverse_TCP Meterpreter Shell (#2 on the list) is always a safe bet. Select it accordingly. From the list of encodings, #16 on the list (Backdoored Executable) is described as the best bet. Make it so. Accept 443 as the default listener port and wait while SET generates injection code as seen in Figure 3.

Figure 3: SET-generated injection code
The Metasploit framework will then launch (wake up, Neo...the matrix has you…follow the white rabbit) and the handlers will standby for your victim to come their way.
Now, as the crafty social engineer that you are, you devise an email campaign to remind users of the “required Java update.” By the way, this campaign can be undertake directly from SET as well via 1) Social-Engineering Attacks | 5) Mass Mailer Attack. When one or more of your victims receives the email and clicks the embedded link they’ll be sent to your SET server where much joy awaits them as seen in Figure 4.

Figure 4: Victim presented with Java required and “trusted” applet
When the victim selects Run, and trust me they will, the SET terminal on the SET server will advise you that a Meterpreter session has been opened with the victim as seen in Figure 5.

Figure 5: Anyone want a shell?
For our last little bit of fun, let’s investigate 3) Infectious Media Generator under 1) Social-Engineering Attacks. If you select File-Format Exploits, after setting up your listener, you’ll be presented with a smorgasbord of payload. I selected 16) Foxit PDF Reader v4.1.1 Title Stack Buffer Overflow as I had on old VM with an old Foxit version on it. Sweet! When I opened the fileformat exploit PDF created by SET with the Foxit 4.1.1, well…you know what happened next.
As discussed in the PwnPlug article, don’t forget the Credential Harvester Attack Methods under Website Attack Vectors. This is quite literally my favorite delivery vehicle as it is utterly bomb proof. Nothing like using the templates for your favorite social media sites (you know who you are) and watching as credentials roll in.

In Conclusion

Evil-me really loves SET; it’s more fun than a clown on fire. Remember, as always with tools of this ilk, you’re the good guy in this screenplay. Use SET to increase awareness, put the fear of God in your management, motivate your clients, and school the occasional developer. Anything else is flat out illegal. J As Dave mentioned, if you have ideas for new features or enhancements for SET, he really appreciates feedback from the community.

Ping me via email if you have questions or suggestions for topic via russ at holisticinfosec dot org or hit me on Twitter via @holisticinfosec.
Cheers…until next month.

Acknowledgements

Dave Kennedy, Founder, TrustedSec, SET project lead

toolsmith: Redline, APT1, and you – we’re all owned

$
0
0


Prerequisites/dependencies
Windows OS and .NET 4

Introduction
Embrace this simple fact, we’re all owned. Maybe you aren’t right now, but you probably were at some point or will be in the future. “Assume compromise” is a stance I’ve long embraced, if you haven’t climbed aboard this one-way train to reality, I suggest you buy a ticket. If headlines over the last few years weren’t convincing enough, Mandiant’s APT1, Exposing One of China’s Cyber Espionage Units report should serve as your re-education. As richly detailed, comprehensive, and well-written as it is, this report is groundbreaking in the extent of insights on our enemy it elucidates, but not necessarily as a general concept. Our adversary has been amongst us for many, many years and the problem will get much worse before it gets better. They are all up in your grill, people; your ability to defend yourself and your organizations, and to hunt freely and aggressively is the new world order. I am reminded, courtesy of my friend TJ O’Connor, of a most relevant Patton quote: "a violently executed plan today is better than a perfect plan expected next week." Be ready to execute. Toolsmith has spent six and half years hoping to enable you, dear reader, to execute; take the mission to heart now more than ever.
I’ve covered Mandiant tools before for good reason: RedCurtain in 2007, Memoryze in 2009, and Highlighter in 2011. I stand accused of being a fanboy and hereby render myself guilty. If you’ve read the APT1 report you should have taken immediate note of the use of Redline and Indicators of Compromise (IOCs) in Appendix G. 
Outreach to Richard Bejtlich, Mandiant’s CSO, quickly established goals and direction: “Mandiant hopes that our free Redline tool will help incident responders find intruders on their network. Combining indicators from the APT1 report with Redline’s capabilities gives responders the ability to look for interesting activity on endpoints, all for free.” Well in keeping with the toolsmith’s love of free and open source tools, this conversation led to an immediate connection with Ted Wilson, Redline’s developer, who kindly offered his perspective:
“Working side by side with the folks here at Mandiant who are out there on the front lines every day is definitely what has driven Redline’s success to date.  Having direct access to those with firsthand experience investigating current attack methodologies allows us stay ahead of a very fast moving and quickly evolving threat landscape.  We are in an exciting time for computer security, and I look forward to seeing Redline help new users dive headfirst into computer security awareness.
Redline has a number of impressive features planned for the near future.  Focusing first on expanding the breadth of live response data Redline can analyze.  Some highlights from the next Redline release (v1.8) include full file system and registry analysis capabilities, as well as additional filtering and analysis tools around the always popular Timeline feature.  Further out, we hope to leverage that additional data to provide expanded capabilities that help both the novice and the expert investigators alike.”

Mandiant’s Lucas Zaichkowsky, who will have presented on Redline at RSA by the time you read this, sums up Redline’s use cases succinctly:
1.       Memory analysis from a live system or memory image file. Great for malware analysis.
2.       Collect and review a plethora of forensic data from hosts in order to investigate an incident. This is commonly referred to as a Live IR collector.
3.       Create an IOC search collector to run against hosts to see if any IOCs match.
He went further to indicate that while the second scenario is the most common use case, in light of current events (APT1), the third use case has a huge spotlight on it right now. This is where we’ll focus this discussion to utilize the APT1 IOC files and produce a collector to analyze an APT1 victim.

Installation and Preparation

Mandiant provides quite a bit of material regarding preparation and use of Redline including an extensive user guide, and twowebinars well worth taking the time to watch. Specific to this conversation however, with attention to APT1 IOCs, we must prepare Redline for a targeted Analysis Session. The concept here is simple: install Redline on an analysis workstation and prepare a collector for deployment to suspect systems.
To begin, download the entire Digital Appendix & Indicators archive associated with the APT1 report.
Wesley McGrew (McGrew Security) put together a great blog post regarding matching APT1 malware names to publicly available malware samples from VirusShare (which is now the malware sample repository). I’ll analyze a compromised host with one of these samples but first let’s set up Redline.
I organize my Redline file hierarchy under \tools\redline with individual directories for audits, collectors, IOCs, and sessions. I copied Appendix G (Digital) – IOCs from the above mentioned download to APT1 under \tools\redline\IOCs.
Open Redline, and select Create a Comprehensive Collector under Collect Data. Select Edit Your Scriptand enable Strings under Process Listing and Driver Enumeration, and be sure to check Acquire Memory Image as seen in Figure 1.

Figure 1: Redline script configuration
I saved the collector asAPT1comprehensive. These steps will add a lot of time to the collection process but will pay dividends during analysis. You have the option to build an IOC Search Collector but by default this leaves out most of the acquisition parameters selected under Comprehensive Collector. You can (and should) also add analysis inclusive of the IOCs after acquisition during the Analyze Data phase.

Redline, IOCs, and a live sample

I grabbed the binary 034374db2d35cf9da6558f54cec8a455 from VirusShare, described in Wesley’s post as a match for BISCUIT malware. BISCUIT is defined in Appendix C – The Malware Arsenal from Digital Appendix & Indicators as a backdoor with all the expected functionality including gathering system information, file download and upload, create or kill processes, spawn a shell, and enumerate users. 
I renamed the binary gc.exe, dropped it in C:\WINDOWS\system32, and executed it on a virtualized lab victim. I rebooted the VM for good measure to ensure that our little friend from the Far East achieved persistence, then copied the collector created above to the VM and ran RunRedlineAudit.bat. If you’re following along at home, this is a good time for a meal, walking the dog, and watching The Walking Dead episode you DVR’d (it’ll be awhile if you enabled strings as advised). Now sated, exercised, and your zombie fix pulsing through your bloodstream, return to your victim system and copy back the contents of the audits folder from the collector’s file hierarchy to your Redline analysis station, select From a Collector under Analyze Data, and choose the copied audit as seen in Figure 2.

Figure 2: Analyze collector results with Redline
Specify where you’d like to save your Analysis Session (D:\tools\redline\sessions if you’re following my logic). Let Redline crunch a bit and you will be rewarded with instant IOC goodness. Right out of the gate the report details indicated that “2 out of my 47 Indicators of Compromise have hit against this session.”
Sweet, we see a file hash hit and a BISCUIT family hit as seen in Figure 3.

Figure 3: IOC hits against the Session
Your results will also be written out to HTML automatically. See Report Location at the bottom of the Redline UI. Note that the BISCUIT family hit is identified via UID a1f02cbe. Search a1f02cbe under your IOCs repository and you should see a result such as D:\tools\redline\IOCs\APT1\a1f02cbe-7d37-4ff8-bad7-c5f9f7ea63a3.ioc.
Open the .ioc in your preferred editor and you’ll get a feel for what generates the hits. The most direct markup match is:
034374db2d35cf9da6558f54cec8a455

In the Reline UI, remember to click the little blue button with the embedded i (information) associated with IOC hit for highlights on the specific IndicatorItemthat triggered the hit for you and displays full metadata specific to the file, process, or other indicator.

But wait, there’s more. Even without defined, parameterized IOC definitions, you can still find other solid indicators on your own. I drilled into the Processestab, and selected gc.exe, expanded the selection and clicked Strings.  Having studied Appendix D – FQDNs, and checked out the PacketStash APT1.rules filefor Suricata and Snort (thanks, Snorby Labs), I went hunting (CTRL-F in the Redline UI) for strings matches to the known FQDNs. I found 11 matches for purpledaily.com and 28 for newsonet.net as seen in Figure 4.

Figure 4: Strings yields matches too
Great! If I have alert udp $HOME_NET any -> $EXTERNAL_NET 53 (msg:"[SC] Known APT1 domain (purpledaily.com)"; content:"|0b|purpledaily|03|com|00|"…snipped enabled on my sensors I should see all the other systems that may be pwned with this sample. 
Be advised that the latest version of Redline (1.7 as this was written) includes powerful, time-related filtering options including Field Filters, TimeWrinkle, and TimeCrunch. Explore them as you seek out APT1 attributes. There are lots of options for analysis. Read the Redline Users Guide before beginning so as to be full informed. J

In Conclusion

I’m feeling overly dramatic right now. Ten years now I’ve been waiting for what many of us have known or suspected all along to be blown wide open. APT1, presidential decrees, and “it’s not us,” oh my. Mandiant has offered both the fodder and the ammunition you need to explore and inform, so awake! I’ll close with a bit of the Bard (Ariel, from The Tempest):
While you here do snoring lie,
Open-ey'd Conspiracy
His time doth take.
If of life you keep a care,
Shake off slumber, and beware.
Awake, awake!
I am calling you to action and begging of your wariness; your paranoia is warranted. If in doubt of the integrity of a system, hunt! There are entire network ranges that you may realize you don’t need to allow access to or from your network. Solution? Ye olde deny statement (thanks for reminding me, TJ). Time for action; use exemplary tools such as Redline to your advantage, where advantages are few.
Ping me via email if you have questions or suggestions for topic via russ at holisticinfosec dot org or hit me on Twitter @holisticinfosec.
Cheers…until next month.

Acknowledgements

To the good folks at Mandiant:
Ted Wilson, Redline developer
Richard Bejtlich, CSO
Kevin Kin and Lucas Zaichkowsky, Sales Engineers

toolsmith: Implementing Redmine for Secure Project Management

$
0
0


Prerequisites/dependencies
VMWare for this methodology or a dedicated installation platform if installed from ISO

Introduction
From Redline for March’s toolsmith to Redmine for April’s, we’ll change pace from hacker space to the realm of secure project management. Following is a shortened version of a much longer Redmine study written for the SANS Reading Room as part of graduate school requirements and released jointly with ISSA.
Security and collaborative project management should not be exclusive. Software designed to support secure project management and security-oriented projects can be both feature rich and hardened against attacks. Web applications such as Redmine offer just such a solution and can embrace the needs of project managers and security practitioners alike. Redmine is project management and bug tracking software built on Ruby on Rails with a focus on collaboration, functionality, and when enhanced with specific plugins, can be configured securely to facilitate security-oriented projects. As a productivity platform, Redmine allows convenient team workflow while embracing the needs of virtual or mobile project members with a focus on socially oriented processes. We’ll explore the secure implementation and configuration of a Redmine server, and then transition into step-by-step details for managing a real world web application penetration testing project using Redmine. This will include the distribution of a virtual machine ready-built for real world use during such projects, pre-configured with a project template based on workflow in the SANS 542 Web Application Penetration Testing course.

From the TurnKey Redmine Web page: “Redmine is a Rails web application that provides integrated project management features, issue tracking, and support for multiple version control programs. It includes calendar and Gantt charts to aid visual representation of projects and their deadlines. It also features multi-project support, role based access control, a per-project wiki, and project forums”. Additionally, a tool such as Redmine allows the convergence of software and security testing. As a software configuration management (SCM) tool, Redmine is ideally suited to projects related to software development. That said, the security expertise required to security test software needs equal consideration and project management. “Sometimes security, or pen-testers for short - work on the same test team as functionality testers; other times, pen-testers work as security consultants and are hired by the software development company to perform security tests”[1]. Regardless of who solicits the use of pen-testers, the related pen-test is a project, and Redmine is the ideal application to provide the agile, flexible platform pen-testers need to coordinate their efforts with the help of a PM or team lead.

Installation

Redmine installation and configuration using a TurnKey Linux Redmine appliance built on a Debian-based Linux distribution, is reasonably straightforward. Your ability to install a Linux operating system from an ISO file on a dedicated machine, or configuring a VMware virtual machine is assumed. It is also assumed you have control of or access to an Active Directory domain for LDAP authentication to Redmine, as it allows for more robust user management. As referenced later, the IP address of the Redmine instance was 192.168.248.16 and 192.168.248.248 for the domain controller. The stable version of the TurnKey virtual Redmine appliance (version 12) running on a lean instance of Debian Squeeze (CLI only, no X11 GUI) via VMWare Workstation 9 was utilized for this research. Note, readers will find running the shell via Putty or a client where you can cut and paste installation strings easier as the VMWare tools aren’t effective without the GUI. This TurnKey Redmine appliance relies on Passenger, a module for Apache that hosts Ruby on Rails applications, and supports the use of SSL/TLS (configured by default) and ModSecurity for better security.
As of this writing the current version of Redmine was 2.2.1 and will be described herein. The installed version of Redmine on the TurnKey appliance is 1.4.4; this guidance will include its upgrade to Redmine 2.2.1.
First, download the Turnkey Linux VM appliance and open it in VMWare.  The first boot routine will ask you to create passwords for the root account, the MySQL root user, and the Redmine admin. When the routine completes you should be presented the TurnKey Linux Configuration Console as seen in Figure 1.

FIGURE 1TurnKey Linux Configuration Console
In the Hardening section, the process of disabling the services you don’t intend to use will be discussed. Take a snapshot of the virtual machine at this point and name the snapshot Base Install.

Update the Redmine version from a command prompt on the Redmine server as follows:
1.                   apt-get update
2.                   apt-get upgrade
3.                   apt-get install locate
4.                   updatedb
5.                   cd /var/www
6.                   mv redmine redmine -old
7.                   hg clone --updaterev 2.0-stable https://bitbucket.org/redmine/redmine-all redmine
8.                   cp redmine -old/config/database.yml redmine/config/database.yml
9.                   cp -r redmine-old/files/ redmine/files/
10.               chown -R root:www-data /var/www/ redmine
11.               cd redmine
12.               gem install bundler
13.               gem install test-unit
14.               bundle install --without development test rmagick
15.               mkdir public/plugin_assets
16.               rake generate_secret_token
17.               rake db:migrate RAILS_ENV=production
18.               chown -R www-data:www-data files log tmp public/plugin_assets
19.               rake redmine:plugins:migrate RAILS_ENV=production
20.               chmod -R 755 files log/ tmp/ public/plugin_assets
21.               rake tmp:cache:clear
22.               rake tmp:sessions:clear
Run the script /var/www/redmine/script/about to confirm the version upgrade.

LDAP authentication is inherent to Redmine but requires a bit of setup. The example Active Directory domain name utilized via a virtual Windows Server 2008 domain controller was REDMINE. The user redminer was established as the service-like account utilized by Redmine to access the directory. Do not user a domain administrator account for this user. Should your Redmine instance be compromised so too then would be your domain. Via your browser, as the Redmine admin user, navigate to Administration then LDAP Authentication. Refer to the Redmine LDAP Authentication page via the Redmine WIKI but refer to the following example configuration as successfully utilized for this research seen in Figure 2.

FIGURE 2: LDAP Configuration
Select Save then, assuming a correct configuration, you should receive indication of a successful connection when you click Test on the resulting Authentication Modes page.

Refer to the SANS Reading Room version regarding additional installation and hardening steps and don’t skip! These are important:
·         Installation
o   Pixel Cookers theme for a streamlined, tech-centric look as well as the
o   Email settings
o   Plugin installation (Ldap Sync, Scrum2B, Screenshot, Monitoring & Controlling)
·         Hardening
o   Disable unnecessary services
o   Tighten down SSH
o   Restrict Redmine web access to HTTPS only
o   Implement UFW (the uncomplicated firewall)

Engaging With Redmine

Following is a step by step description of a penetration testing engagement where Redmine is utilized to provide project support for a team of three.
The first and most important steps to undertake are the elimination of all unwanted permissions for the Non member and Anonymous roles. Login to Redmine as the admin user and select Administration | Roles and permissions | Non member | Uncheck all | Save. Repeat this process for the Anonyomous roles. These steps will ensure that you don’t inadvertently expose project data to those who don’t have explicit permission to view it. Next, to add users for this project, select Administration | Groups to add a group called PenTesters.  From Administration| Users add three users with appropriately defined login names pentester1 (Fred), pentester2 (Wilma), pentester3 (Barney), and pentestpm (BamBam) and add them to the PenTesters group. Remember these users need to also have been created in the domain you’re utilizing for LDAP authentication. Via the Administrationmenu, under Projects, create a project called Web Application Pentest. The activities related to this project are drawn directly from tasks outlinedin the SANS 542: Web App Penetration Testing and Ethical Hacking course as well as the Samurai Web Testing Framework. Select all Modules and Trackers for the project. You’ll note that Monitoring and Controlling by Project and Scrum2b are available as implemented during the installation phase described earlier. These plugins will be described in more detail as their use is inherent to agile project management for projects such as penetration testing.
Redmine allows the creation of subprojects as well; the Web Application Pentest project should be divided into four subprojects named as follows: 1-Recon, 2-Mapping, 3-Discovery, and 4-Exploitation. Add each of them from Redmine Web Application Pentest project page and remember to enable all Modules and Trackers.
Add the user accounts for the three penetration testers and the project PM user as project and subproject members via the Members tab as seen in Figure 3.

FIGURE 3: Pen-test Project Members
Return to the project overview, select 1-Recon under subprojects, and add a new issue. File a bug for each recon phase task you’d like completed, with the applicable start and due dates. You can upload related files, screenshots (thanks to the plugin installed earlier), and designate an assignee, as well as watchers.
Under Settings for each project or subproject you define you can establish issue categories. This is an ideal method by which to establish penetration testing activities for each subproject. As an example, the recon phase of a web application penetration test includes general recon along with DNS and Whois lookups, search engine analysis, social network analysis, and location analysis. Establishing each of these as issues categories will then allow bugs (tasks) to be filed specific to each category. Each bug can in turn be assigned a pen-tester with start and end dates, along with files that might be useful to complete the task. Location analysis could include gleaning location data from victim Tweets as described in Violent Python[2]. Twitter provides an API to developers which allows information gathering about individuals (potential penetration test targets). A script from Violent Python to help in this information gathering can be uploaded into the Redmine bug, Location data from Tweets as seen in Figure 4.

FIGURE 4: Bug (task) assigned to Fred, with helper code
As bugs are added, assigned, and/or updated, if configured to communicate verbosely, Redmine will email notices to the appropriate parties. The email as seen in Figure 5 was received as a function of filing the bug in Figure 4.

FIGURE 5: Email notice for bug (task) filed
This allows real-time communication among penetration testers or any project participants defined in your Redmine deployment. As pen-testers generate findings, they can be uploaded to the associated bug, and if versioning is required, managed via the Mercurial SCM offering as described during installation.
Bug status can be tracked as New, In Progress, Resolved, Feedback, and Closed or Rejected, and each bug can be assigned a priority and estimated time. As completed, actual time spent on each bug can be tracked too. Overall project time allotments as defined in the bug then track quite nicely via the Redmine Gantt functionality as seen in Figure 6.

FIGURE 6: Redmine Gantt functionality
Scrum2b

The concept of agile software development has, over time, been applied directly to project management. Consider the use of Scrum methodology as part of agile project management. According to Agile Project Management with Scrum, “the heart of Scrum lies in the iteration. The team takes a look at the requirements, considers the available technology, and evaluates its own skills and capabilities. It then collectively determines how to build the functionality, modifying its approach daily as it encounters new complexities, difficulties, and surprises. The team figures out what needs to be done and selects the best way to do it. This creative process is the heart of the Scrum’s productivity”[3]. These creative processes, assessment of capabilities, and changing complexities and surprises are also inherent to any penetration test and as such, the agile project management framework is an ideal way to coordinate pen-test projects. The Scrum2b plugin for Redmine is well suited to answer this calling. If each phase of the pen-test is considered a sprint as defined by the Scrum process, the planning and awareness necessary to support the sprint is essential. The Scrum2b interface is a virtual Scrum Board that allows project participants to track activities by bug and members while editing the bug on the fly with the appropriate permission. The pentestpm user, as project manager, could adjust task’s percentage of completion right from Scrum2b using the time slider.

FIGURE 7: Scrum2b Scrum Board for pen-testers
If the assignee needs to jump right to the bug, the plugin is fully hyperlink enabled. The Scrum Board allows filtering the view by members and issues. New issues can also be added right from the Scrum Board.

Monitoring & Controlling

All projects require the right balance of monitoring and controlling, and penetration tests are no exception. The Monitoring and Controlling Project Work process includes “gathering, recording, and documenting project information that provides project status, measurements of progress, and forecasting to update cost and schedule information that is reported to stakeholders, project team members, management, and others”[4]. The Monitoring & Controlling plugin for Redmine shines in this capacity. Established as a convenient left-pane menu item with the Pixel Cookers theme, this plugin creates a dashboard for project data organized by Tasks Management, Time Management, and Human Resource Management. Tasks Management tracks Tasks by Status, Tasks by Category, and Task Management (manageability). Applied again to the context of a pen-test project, Figure 8 represents the Recon phase of a pen-test.

FIGURE 8: Monitoring & Controlling Tasks Management
Refer again to the SANS Reading Room version, page 17, for more regarding Time & Human Resources Management with the Redmine Monitoring & Controlling plugin.

In Conclusion

Project management includes a certain amount of tedium, but Redmine configured with the aforementioned plugins allows for a refreshing, dynamic approach to the overall secure project management lifecycle. While no system is ever absolutely secure (a serious Ruby on Rails SQL injection flaw was disclosed as this paper was written), the appropriate hardening steps can help ensure enhanced protection. Steady maintenance and diligence will also serve you well. The convenience of an implementation such as TurnKey Redmine makes keeping the entire system up to date quite easy.
A version of a TurnKey Redmine virtual machine as discussed here will be made available to readers via the HolisticInfoSec Skydrive. This instance will include a web application project template, with predefined subprojects, issue categories and bugs, again as defined in the SANS 542 course. Readers will need only create users, assign dates and members, and establish access to an LDAP service.
Ping me via email if you have questions or suggestions for topic via russ at holisticinfosec dot org or hit me on Twitter @holisticinfosec.
Cheers…until next month.

References


[1] Gallagher, Jeffries, and Landauer (2006). Hunting Security Bugs, Redmond, WA: Microsoft Press.
[2]O'Connor, T. (2013). Violent python. (p. 229). Walthm, MA: Syngress.
[3]Schwaber, K. (2004). Agile project management with scrum.
[4]Heldman, K. (2009). Pmp: Project management professional exam study guide. (Fifth ed.). Indianapolis, IN: Sybex.

toolsmith: Recon-ng

$
0
0


Prerequisites/dependencies
Python interpreter-enabled system, Kali Linux utilized for this review

Introduction
The community of tools and developers converges again this month as we explore Tim Tomes’ Recon-ng. Jeremy Druin, whose NOWASP Mutillidae we explored in August 2012’s toolsmith, introduced me to Tim, having recognized another great tool worthy of exploration and sharing with toolsmith nation. Recon-ng is optimized for use during the reconnaissance phase of web application penetration testing. You’ll note convergence again given that we described managing web application penetration testing phases in last month’s toolsmith regarding Redmine. Tim says it best on his Recon-ng site: “Recon-ng is not intended to compete with existing frameworks, as it is designed exclusively for web-based open source reconnaissance. If you want to exploit, use the Metasploit Framework. If you want to Social Engineer, us the Social Engineer Toolkit. If you want to conduct reconnaissance, use Recon-ng!
More from Tim on Recon-ng, shared exclusively with toolsmith:
Recon-ng is commonly seen as being most useful in the role of supporting Social Engineering engagements, but the real power of the framework lies in its ability to perform all steps of the traditional penetration testing methodology, except exploitation, within the context of reconnaissance. What does that mean? It means that we can do scope validation through host discovery, server enumeration, vulnerability discovery, and gain access to authentication credentials, all without sending a single packet to the target application or network. Recon-ng does this by leveraging powerful, 3rd party, web-based resources that do all of this stuff for us, and provide access to the results. It is important to keep in mind that there are caveats to this. Using 3rd parties to collect data on clients may be in direct violation of Non-Disclosure Agreements (NDA) or contracts. It is up to the tester to make sure that the client specifically approves this activity as part of the testing agreement.
While the framework is named for its focus on reconnaissance, the intent is not to limit its functionality to only recon. Python developers have been waiting a long time for a fun, easy, and useful project to contribute to. They now have that in Recon-ng. Therefore, when contributors come up with new ideas for modules that cross the boundary of reconnaissance into active discovery and exploitation, they are encouraged to submit them for review. The several discovery modules included in the framework are good examples of this.
I get asked quite often, "How does Recon-ng fit into your testing methodology?" The answer is simple. It's the first tool I use on every engagement, and often during the scoping process. Do I run every module in the framework? No. It largely depends on the type of assessment. But there are several things I always do. I always harvest hosts from Google, Shodan and IP-Neighbors and enumerate with the Resolve, BuiltWith and PunkSPIDER modules. I always harvest contacts using Jigsaw, LinkedIn, PGP and Whois, and mangle them into email addresses with the Mangle module. And I always check for compromised accounts and harvest any available credentials using the various PwnedList modules.

We’ve provided much detail on the web application penetration testing methodology as describe by SANS in earlier toolsmiths, so in order to broaden our horizons a bit, I’ll plug Recon-ng use into the various phases of the OWASP Testing Guide v4. Version 4 is the draft version, version 3 (2008) is considered stable. The Information Gathering section of the guide is a ten-part contribution to Section 4 of the guide, Web Application Penetration Testing. Immediately relevant steps from the draft TOC include:
·         4.2.1 Testing for Web Server Fingerprint (OWASP-IG-004)
·         4.2.2 Review Webserver Metafiles (OWASP-IG-001)
·         4.2.5 Identify application entry points (OWASP-IG-003)
We’ll also use reconnaissance methods to lend to section 4.4.2 Testing for User Enumeration and Guessable User Account (OWASP-AT-002) from 4.4 Authentication Testing.
We’ll use Recon-ng to realize the goals of a few of these OWASP Testing Guide steps as we explore further below.

Recon-ng Installation

Recon-ng installs with ease on any Python and Git enabled system. On Kali, running as root, it’s as simple as:
cd recon-ng
./recon-ng.py
Figure 1 represents the initiated Recon-ng shell and its 57 recon, 6 discovery, 1 exploitation, and 2 reporting modules.

FIGURE 1: Getting underway with Recon-ng
The dependencies on dnspython, httplib2, and python-oauth2 are already met in the recon-ng lib directory. If you’re familiar with Metasploit you’ll be right at home with Recon-ng. Refer to the wiki for a usage overview. I worked with both the stable version 1.20, as well as the beta of 1.30, which should be a stable release by the time you read this. 1.30 includes major updates including what @LaNMaSteR53 Tweeted is a badly needed API key handling system.

Putting Recon-ng to use

A few quick use pointers may help you get under way with Recon-ng. Command completion is handy as you consider typing commands such as
use recon/contacts/enum/http/should_change_password.
Hitting tab while keying will complete based on options for command or parameter. Also extraordinarily useful is the smart load feature which allows loads modules when you refer to a keyword unique to the desired module's name. As an example, for the first module we’ll test I simply typed use xssed which loaded the recon/hosts/enum/http/web/xssed module. This works well without the full path as it is the only module containing the string xssed but if multiple modules share the same keyword you’ll receive a list of possible modules. Use is also, in reality, an alias for the load command; they work identically. Apparently, overly sensitive Metasploit users bugged Tim until created command alignment. From a Recon-ng prompt the best way to see all modules available to you is to pass the show modules command, and don’t forget to use the ? command when you need more information. As an example show ? reveals your usage options are show [modules|options|workspaces|schema|]
. With a particular module loaded, use info for name, author, description, and options details. Then use set based on the options defined followed by the run command. That’s all there is to it. You can define individual workspaces or other global options as well. I ran show optionsthen set workspace holisticinfosecfor our efforts here. You can also set proxy settings here if you wish to record your sessions with the like of Burp Suite. The resulting report from Burp is a nice output product for your pentest engagements. Equally useful might be the use of an anonymizing proxy.

Use the recon/hosts/enum/http/api/builtwith module for 4.2.1 Testing for Web Server Fingerprint (OWASP-IG-004). As the guidance states “knowing the version and type of a running web server allows testers to determine known vulnerabilities and the appropriate exploits to use during testing” you can imagine why. I loaded the module, passed set host holisticinfosec.org, and followed with run, resulting in Figure 2.

FIGURE 2: Recon-ng establishes server details
For 4.2.2 Review Webserver Metafiles (OWASP-IG-001) an ideal module is discovery/info_disclosure/http/interesting_files. This is not a passive module; it will reach out and touch the defined source, and download discovered files such as robots.txt, sitemap.xml, crossdomain.xml, and phpinfo.php. The discovered and downloaded files are written to the workspace directory in which you are operating. The /recon-ng/workspace/default workspace is the default if none is specified in the global options.

The xssed module relates nicely to section 4.2.5 Identify application entry points (OWASP-IG-003) which describes the process to identify application entry points. OWASP’s brief overview of this phase states that “enumerating the application and its attack surface is a key precursor before any attack should commence. This section will help you identify and map out every area within the application that should be investigated once your enumeration and mapping phase has been completed.” Parameters vulnerable to cross-site scripting (XSS) via GET or POST requests certainly fall in the “worthy of investigation” category as variables exhibiting XSS vulnerabilities are sometime vulnerable to other issues such as SQL injection or directory traversal. Of course, XSS in and of itself represents a number of opportunities for the attacker and should be paid close attention as such.
The xssed module as written by Micah Hoffman (@WebBreacher) checks XSSed.com for XSS records for the given domain and displays the first 20 results. From the Recon-ng prompt I passed the use xssed command followed by set domain microsoft.com. Given that I work there and my attack & penetration testing may have a Microsoft domain in scope for a penetration test, this module could prove a logical first step. Note that all the returned results for this effort have been fixed even if results state otherwise.  After setting the domain parameter one need only issue a runcommand to kick off the module. Figure 3 shows the results.

FIGURE 3: Recon-ng XSSed module results
The result advises us that, had it not been fixed, the search parameter would have been ideal for further exploration or use in packaging XSS payloads during an exploitation phase.

Recon-ng’s LinkedIn Authenticated Contact Enumerator is a great way to gather possible social engineering or bruteforcing targets, ideal during the 4.4.2 Testing for User Enumeration and Guessable User Account (OWASP-AT-002) phase. You’ll need a LinkedIn API key; just login with you LinkedIn cred and visit the LinkedIn Developer Network. Note: a few Recon-ng modules require API keys. Keep in mind that the Pwnedlist API has a rather high cost associated with it, but if your organization has already purchased API access, you can leverage it with Recon-ng for the Pwnedlist modules account_creds, api_usage, domain_creds, domain_ispwned, leak_lookup, and leaks_dump. Tim pointed out that, as a Pwnedlist customer, he extremely fond of the domain_credsmodule in particular as it returns actual domain credentials. Nothing like walking in to a customer penetration testing engagement already in possession of domain creds. For the LinkedIn module run use linkedin, followed by set company , then run. No screenshot here as the module dumps lots of juicy contact data and I don’t want a bunch of folks upset with me.

Keep in mind that you can always query the native Recon-ng SQLite database with the query command followed by common SQL syntax. As an example query select * from hosts returns data populated in the columns host, ip_address, region, country, latitude, and longitude during module runs. The database schema is included in Figure 4.

FIGURE 4: Recon-ng database schema
Finally, you will definitely want to take advantage of the reporting modules.
Tim mentioned that the reporting/csv_file module is great for importing into Excel then massaging the data while reporting/html_report module is optimal for producing reports for customers. Figure 5 shows my reporting run against all date I’d written so for the db.

FIGURE 5: Recon-ng database schema
There are, as is often the case with great toolsmith topics, too many features and killer use case scenarios to cover here. I even suggested to Tim he write the Recon-ng book. Yes, I think it’s that good.

In Conclusion

I’m really excited about Recon-ng and wish Tim great success. My two favorite phases are reconnaissance and exploitation and Recon-ng fits the bill to dominate the first and contribute greatly to the second. Setting it up and getting started is a sixty second proposition and leaves you no room for excuses. Get cracking with this tool STAT, run it against entities specific to your organizations, and immediately benefit. Or there’s always the alternative of waiting and having the hackers do it for you.
Ping me via email if you have questions or suggestions for topic via russ at holisticinfosec dot org or hit me on Twitter @holisticinfosec.
Cheers…until next month.

toolsmith: Visual Malware Analysis with ProcDOT

$
0
0


Prerequisites/dependencies
Windows or Linux operating system

Introduction
As I write this I’m sitting in the relative darkness of the HolisticInfoSec lab listening to Random Access Memories, the new release from Daft Punk, and literally freaking out over what Time magazine’s Jesse Dorris has glowingly referred to as a “sound for which the word epic seems to have been invented.” Follow me as I step way out on a limb and borrow from Dorris’ fine review to create a musical allegory for this month’s topic, ProcDOT. Dorris describes a “world in which the bounties of the past, present and future have been Tumblr’d together into a stunning data blur.”[1] I will attempt to make this connection with what ProcDOT’s author, CERT.at’s Christian Wojner, refers to as “an absolute must have tool for everyone's lab.” This is a righteous truth, dear reader; those malware analysts amongst you will feast on the scrumptious visual delight that ProcDOT creates.
We’ve not discussed visualization tactics in quite a while (March 2010) but read on, the wait will be justified. ProcDOT, as described in Christian’s March 2013 blog post, correlates Windows Sysinternals Process Monitor log files and PCAPs to an investigation-ready interactive graph that includes the animation of a malware infection evolution based on activity timelines.
Christian gave me the full picture of his work creating ProcDOT to be shared with you here.
ProcDOT is the result of two ideas Christian had over the last few years. Initially he was thinking about the benefits of correlating Process Monitor logs with PCAP data to simple line charts with time and peaks as well as the ability to define tags for specific data situations. Sometime later, at the end of a malware investigation for a customer, he came to the point where he wanted to explain the characteristics of the underlying infection and depict the interaction of the malware's components as part of his final report. Christian found that a simple verbal description was both massively inefficient and insufficient at the same time (I confirm this shortcoming as well). Christian’s thinking moved to the “big picture” in terms of a graph with nodes for the relevant objects as files, registry keys, etc. and edges for actions between them.
He then took the time to experiment with the Process Monitor logs he’d captured while trying to strip them down to the relevant content. This content he then manually converted to fit the input format of AT&T’s Graphviz as chosen as a renderer for graphing. And there it was; a picture can tell a thousand words. It immediately became easy to understand all the aspects of the infection in one glance, even without any verbal explanation. That said, the manual activities to get to this result took about 50% of Christian’s time during report generation and he had not yet included PCAP data at this point.
As the high potential of this approach proved itself obvious, Christian started to think about a tool that might take advantage of all this potential while bringing behavioral analysis a step further and making it accessible to non-malware analysts. Thus was born the ProcDOT project.
As ProcDOT is now close to its first official release it is actually possible to automatically generate such a graph within seconds while also considering the information in an optionally supplied PCAP file correlating them with the Process Monitor logs. ProcDOT’s infection evolution animation capabilities also eradicates the downside of older graphing techniques lacking the ability to effectively visualize the aspect of time.
Christian’s road map (future think) for ProdDOT includes:
·         Export capabilities for the graph
·         Consider and provide much more information of PCAP data
·         Time and context-dependent ranges of frames/events
·         Customizable color themes
·         Notes and tags
·         Better GUI support of filters
·         Session related filters

This is a tremendous project and I look forward to its long life with ongoing support. As we run it through its paces I am quite certain you’ll come to the same conclusion.

ProcDOT Preparation

Christian has provided good documentation, including some easily avoided pain points that are worthy of repeating here. Process Monitor’s configuration needs to be tuned to ensure ProcDOT compatibility.
In Process Monitor:
·         Under Options, disable (uncheck) "Show Resolved Network Addresses"
·         Via OptionsàSelect Columns, adjust the displayed columns
o   To not show the "Sequence Number" column
o   To show the "Thread ID" column

Figure 1 exemplifies the correct Process Monitor configuration.

Figure 1: Process Monitor configuration to support ProcDOT


ProcDOT also needs to know where its third party tool dependencies are fulfilled.
In ProcDOT, under Options:
·         Choose your Windump/Tcpdump executable as a fully qualified path
·         Choose your Dot executable (dot.exe) as fully qualified path

Figure 2 shows my ProcDOT configuration as enabled on a 64-bit Windows 8 analysis workstation running the 64-bit version of ProcDOT. Keep in mind that the ProcDOT project releases a version that runs on Linux as well.

Figure 2: ProcDOT tool path configuration
ProcDOT visualization

I worked with a couple of different samples to give you a sense of how useful ProcDOT can be during runtime analysis. I started with a well detected Trojan dropper (Trojan/Win32.Qhost) from a threat-listed URL courtesy of Scumware.org, “just another free alternative for security and malware researchers,” to trace interesting behavior when executing 3DxSpeedDemo.exe on a victim system. The MD5 for this sample is 20928ad520e86497ec44e1c18a9c152e if you’d like to go get it for yourself. Alternatively, if you’d like to avoid playing with malware and just want the Process Monitor CSV and related PCAP, ping me via email or Twitter and I’ll send them to you. I ran the malicious binaries on a 32-bit Windows XP SP3 virtual machine, capturing the related Process Monitor CSV log and the PCAP taken with Wireshark, then resetting to a clean snapshot for each subsequent analysis. You need to ensure that you save your default Process Monitor .PML file to .CSV which is easily done by selecting Save, choosing All Eventsand the CSV format. I copied the .PCAP and .CSV files from each run to my workstation and created visualizations for each.
Loading ProcDOT and readying it for a visualization run is simple. In the UI, select the appropriate CSV from Procmon-CSV field and PCAP from the Windump-File field. Note that the selection window for Windump-File defaults to Windump-TXT (*.txt); simply switch to Windump-PCAP (*.pcap) unless you actually generated text results. Check the no paths and compressed boxes, and hit Refresh.
This will generate an interactive graph, but you won’t yet see results. You now must select the Launcher, ProcDOT will analyze the Process Monitor file, then ask you to select the first relevant process. This is typically the malicious executable (double-click it) you executed on your virtual machine or intentionally compromised system; again, 3DxSpeedDemo.exe for my first run, as seen in Figure 3.

Figure 3: ProcDOT malicious process selection
Hit Refresh one more time and voila, your first visualization.
A few ProcDOT navigation tips:
1)      Hold CTRL and roll the scroll wheel on your mouse to zoom in and out.
2)      Hold your left mouse button while hovered over the graph to move it around in the UI.
3)      Double-click an entity to zoom in on it.
4)      Right-click an entity for details. Hit ESC to remove the highlighting.
At the bottom of the UI if you click the film click, ProcDOT will move into playback mode and step through each process as they were captured. Remember our mention above of infection evolution animation capabilities that give you the ability to effectively visualize the aspect of time? Bingo.
Check out the Legend under help (?) for the breakdown on the symbols used in graphing.
As I played back the Win32.Qhost infection, Frame 91 jumped out at me where Thread 1168 of the cmd.exe process (PID 1828) wrote data to the hostsfile as seen in Figure 4.

Figure 4: ProcDOT captures Win32.Qhost writing to the hosts file
Oh snap! I love malware that does this. I jumped back to my malware VM, re-executed the malware, and captured the hosts file from C:\Windows\System32\Drivers\etc.
Figure 5 gives you an immediate sense of who the players are in this little vignette.

Figure 5: You want me to login where?
The IP address 91.223.89.142 is indeed in the Russian Federation but is not the appropriate A record for odnoklassniki.ru, or mail.ru, or vk.com, or ok.ru…you get the idea. I find it ironic that a seemingly Russian perpetrator is targeting Russian users as Eastern Bloc cybercriminals favor spreading their little bits of joy beyond their own borders. Just sayin’.
The Zbot sample I analyzed (MD5: 58050bde460533ba99d0f7d04eb2c80a) made for great network behavior analysis with ProcDOT. I can’t possibly capture all the glorious screen real estate here, but Figure 6 should give you an idea of all the connections spawned by explorer.exe.

Figure 6: ProcDOT network analysis
So many avenues to explore, so little time. Take the time, it’s a rabbit hole you definitely want to go down. There’s so much value in ProcDOT for malware analysts, incident responders, and forensicators. Paint a picture, cut to the quick, “the bounties of the past, present and future” await you in a “stunning data blur” created by ProcDOT. See Figure 7 for enough proof to motivate you to explore on your own.

Figure 7: A stunning data blur…
In Conclusion

We’ve covered some truly kick@$$ tools already this year; Violent Python, SET, Redline, and Recon-ng put ProcDOT in some major company, but if I were able to vote for Toolsmith Tool of the Year in 2013, ProcDOT would be right at the top of my list. The current release is a still an RC, if you find any bugs let Christian know. The roadmap is solid so I am really looking forward to the stable releases soon to come. In particular, export capabilities for the graph will be a big step. Again, sample CSVs and PCAPs are available on demand.
Ping me via email if you have questions or suggestions for topic via russ at holisticinfosec dot org or hit me on Twitter @holisticinfosec.
Cheers…until next month.


[1] Dorris, J. (2013, MAY 27). Robots, rebooted. electro-pop duo daft punk's triumphant new record. Time,181(20), 60.

toolsmith: EMET 4.0 - These Aren’t the Exploits You’re Looking For

$
0
0

Prerequisites
Windows operating system
.NET Framework 4.0 or higher

Introduction
In classic Star Wars parlance, have you been looking for improved tactics with which to wave off grievous Windows client exploits? Look no further; Microsoft’s Enhanced Mitigation Experience Toolkit (EMET) 4.0 was released to the public on 17 JUN 2013 and quickly caught the attention of security aficionados and general press alike. KrebsOnSecurity even gave EMET full coverage and as always Brian’s quality work is well worth a read for the 101 perspective on EMET 4.0. So much of the basic usage, configuration, and feature set has already been covered or introduced that I’m going to simply refer you to the Kreb’s post as well as Gerardo Di Giacomo’s ThreatMitigation with EMET 4.0 as prerequisite reading material. I work with Gerardo at Microsoft and as with all toolsmith’s I sought insight on the tool in question. As his Threat Mitigation post had just gone live as we talked, I will simply draw a quick summary from there; you can read the rest for yourself. EMET is a “free utility that helps prevent memory corruption vulnerabilities in software from being successfully exploited for code execution. It does so by opting in software to the latest security mitigation techniques. The result is that a wide variety of software is made significantly more resistant to exploitation – even against zero day vulnerabilities and vulnerabilities for which an update is not available or has not yet been applied. EMET offers protections for all currently supported Microsoft Windows operating systems, and supports enterprise deployment, configuration, and monitoring.” I will give you the quick bullet list of features but will move quickly to what exploitation mitigations EMET 4.0 offers when tossing attacks via Metasploit against a protected system and applications. Following are feature highlights for EMET 4.0:
·         Certificate Trust: Detect Man in the Middle (MITM) attacks that leverage fraudulent SSL certificates
·         ROP mitigations: Block exploits that utilize Return Oriented Programming exploitation techniques.
·         Early Warning Program: Allows enterprise customers and Microsoft to analyze the details of an attack and respond effectively.
·         Audit Mode: Provides monitoring functionalities for testing purposes.
·         Redesigned User Interface: Streamlined configuration and improved accessibility.
Of note, the Early Warning Program sends information back to Microsoft. If yours is an organization that already does this via other enterprise means, this is already common place behavior, but if your preference is to keep such data in house you can disable Early Warning under the Reporting menu or use System Center Agentless monitoring to forward the telemetry data to an on-premise server that can be later used for forensics or post-mortem. In production environments, you may want to make use of Audit Mode before setting EMET to terminate programs when attacked. Audit Mode instead simply reports the exploitation attempt; helpful for monitoring potential compatibility issues between EMET and protected applications.
  
Installing EMET 4.0

Installing EMET is point-and-click simple. Just download, ensure you have .NET Framework 4.0 or higher installed, accept installation defaults (Use Recommended Settings), and you’re off to the races.
The EMET 4.0 User’s Guide included on the download page is a required read as well. I ran EMET 4.0 on a Windows 7 SP1 Enterprise 32bit VM with .NET Framework 4.0, Java 1.7.0_25, and Firefox 22 (really?).
For testing, enabled the Maximum security settings under Quick Profiles. This sets Data Execution Prevention (DEP) to Always On and Structured Exception Handler Overwrite Protection (SEHOP) to Application Opt Out as seen in Figure 1.

FIGURE 1: EMET deployed and ready
That said, on production systems, take baby steps. You can begin to add other applications than those protected by default (Internet Explorer, Java, Wordpad, Adobe Reader, Microsoft Office, etc.) but as mentioned above and in Kreb’s article, phase apps in to ensure they don’t struggle or crash with the added protection and “avoid the temptation to make system-wide changes.”

EMET 4.0 Mitigations and Blocked Attacks

First up, ye olde heap spray attack. Via Metasploit on my Kali Linux VM, I queued up the Microsoft Internet Explorer Fixed Table Col Span Heap Overflow (MS12-037)module. This module “exploits a heap overflow vulnerability in Internet Explorer caused by an incorrect handling of the span attribute for col elements from a fixed table, when they are modified dynamically by JavaScript code” and utilizes ROP chains as part of the attack. Drawing right from Rapid 7, as they describe heap spray techniques for Metasploit browser exploitation, a heap spray is a way to manipulate memory by controlling heap allocations and placing arbitrary code in a predictable place.  This allows the attacker, when controlling the crash, to trick a program into going to said predictable place and gain code execution. Figure 2 represents the attempted delivery of such an attack via MSF.

FIGURE 2: MS12-037 IE Col Span attack
On the Windows 7 VM, when browsing to my attacker server, http://192.168.220.145:8080/JwJKD1Sjq, via Internet Explorer, EMET immediately responded with an application mitigation, shut down IE and popped a Tray Icon notification as seen in Figure 3.

FIGURE 3: EMET blocks HeapSpray attack
Given that EMET also writes events to the Windows Application Event Log, enterprises are afforded an additional monitoring opportunity as a result. No matter your Windows event collection mechanism, be it Windows Event Collector, Audit Collection Services (ACS), OSSEC, Snare and Splunk, or your preferred method, you can add an alerting mechanism (you may be feeding a SIEM) to give you a heads up when a client machine triggers an EMET event. Regardless, Figure 4 represents the Event Viewer perspective on our attack from Figure 2.

FIGURE 4: EMET event in Event Viewer
Another example includes the Mandatory ASLR mitigation. Address space layout randomization (ASLR) randomly arranges the positions of key data areas, to include the base of the executable, as well as position of libraries, heap, and stack, in a process's address space. Note that, as indicated in the EMET User’s Guide, EMET’s mitigations only become active after the address space for the core process and the static dependencies has been set up. Mandatory ASLR does not force address space randomization on any of these. Instead, Mandatory ASLR is intended to protect dynamically linked modules, such as plug-ins. When I browsed my Metasploit instance configured with the Internet Explorer CSS Recursive Import Use After Free module (MS11-003) enabled Internet Explorer was again terminated as seen in Figure 5

FIGURE 5: EMET Mandatory ASLR notification
Last but not least, I tested the Certificate Trust (Pinning)feature by manipulating the pinned certificates for login.live.com. EMET 4.0 protects the likes of Live, Yahoo, Skype, Twitter, Facebook and Office 365 by adding extra checks during the certificate chain trust validation process, with the goal to detect man-in-the-middle attacks over an encrypted channel. By default, EMET pins the certificate for a website to the good, trusted Root CA certificate; login.live.com is pinned to Baltimore CyberTrust Root, Verisign, GlobalSign Root CA, and GTE CyberTrust Global Root, as these are the Root CA certificates that are expected to have issued a certificate for login.live.com. I arbitrarily removed these and imported a Thawte Windows Trusted Root Certificate (trusted by Windows). This resulted in EMET sounding off with another “I don’t think so” as seen in Figure 6.

FIGURE 6: EMET trusts you not
As Thawte is clearly not the Root CA that issued the certificate for login.live.com, EMET flagged the SSL cert. By pinning the right certificates’ websites to their expected Root CA certificates, you can detect scenarios where a certificate is fraudulently issued from a compromised Root CA or one of its intermediates.
For you command line fans, you can choose to utilize EMET_Conf.exe. You’ll need to set C:\Program Files\EMET 4.0 in your PATH statement if you wish to call EMET_Conf.exe from any prompt. EMET_Conf.exe allows you to add applications, list those already added, list enabled mitigations and trusts, as well as remove, modify, import/export, and configure.
Remember, for those of you with enterprise deployment responsibilities, EMET can be deployed and configure with System Center Configuration Manager (SCCM), and EMET system and application mitigation settings can be configured via Group Policy.

In Conclusion

The release of version 4.0 brings EMET squarely in sight for users who may have been hesitant to utilize or deploy it. Now’s the time to investigate and engage (wait, that’s Star Trek). EMET 4.0 adds a layer of protection that friend, and EMET’s #1 fan, TJ O’Connor refers to as “creativity in defense”; I'll give him the closing comments:
"All too often the balance of creativity favors the attacker. Attackers overcome difficult exploit mitigation strategies by hurdling over them with creative attack strategies. Attackers have succeeded with creative techniques like heap-spraying, ROP Gadgets, SEH Overwrites, or ASLR partial over-writes. EMET 4.0 returns the balance of creativity to the defender. Instead of looking for fixed known signatures of attack, EMET 4.0 looks for the adversary trying to hurdle over the mitigation strategy. Because of this, EMET can identify a novel attack and stop it without previous knowledge of the attack. Its the most overlooked game changer in a defense strategy." 
Remember, test and tune before going full tilt boogie but know that EMET adds defense-in-depth for one host or an entire enterprise, even in the face of 0-days.
Ping me via email if you have questions (russ at holisticinfosec dot org).
Cheers…until next month.

Acknowledgements

Gerardo Di Giacomo, Security Program Manager, Microsoft Security Response Center (MSRC) Software Security Incident Response team

toolsmith: C3CM Part 1 – Nfsight with Nfdump and Nfsen

$
0
0


Prerequisites
Linux OS –Ubuntu Desktop 12.04 LTS  discussed herein

Introduction
I’ve been spending a fair bit of time reading, studying, writing, and presenting as part of Office Candidate training in the Washington State Guard. When I’m pinned I may be one of the oldest 2ndLieutenants you’ve ever imagined (most of my contemporaries are Lieutenant Colonels and Colonels) but I will have learned beyond measure. As much of our last drill weekend was spent immersed in Army operations I’ve become quite familiar with Army Field Manuals 5-0 The Operations Process and 1-02 Operational Terms and Graphics. Chapter 2 of FM 1-02, Section 1 includes acronyms and abbreviations and it was there I spotted it, the acronym for command, control, and communications countermeasures: C3CM. This gem is just ripe for use in the cyber security realm and I intend to be the first to do so at length.  C2 analysis may be good enough for most but I say let’s go next level. ;-) Initially, C3CM was most often intended to wreck the command and control of enemy air defense networks, a very specific Air Force mission. Apply that mindset in the context of combating bots and APTs and you’re onboard. Our version of C3CMtherefore is to identify, interrupt, and counter the command, control, and communications capabilities of our digital assailants. 
Part one of our three part series on C3CM will utilize Nfsight with Nfdump, Nfsen, and fprobe to conduct our identification phase. These NetFlow tools make much sense when attempting to identify the behavior of your opponent on high volume networks that don’t favor full packet capture or inspection.
A few definitions and descriptions to clarify our intent:
1)      NetFlow is Cisco’s protocol for collecting IP traffic information and is an industry standard for traffic monitoring
2)      Fprobe is a libpcap-based tool that collects network traffic data and emits it as NetFlow flows towards the specified collector and is very useful for collecting NetFlow from Linux interfaces
3)      Nfdump tools collect and process NetFlow data on the command line and are part of the Nfsen project
4)      Nfsen is the graphical web based front end for the Nfdump NetFlow tools
5)      Nfsight, our primary focus, as detailed on its Sourceforge page, is a NetFlow processing and visualization application designed to offer a comprehensive network awareness. Developed as a Nfsen plugin to construct bidirectional flows out of the unidirectional NetFlow flows, Nfsight leverages these bidirectional flows to provide client/server identification and intrusion detection capabilities.
Nfdump and Nfsen are developed by Peter Haag while Nfsight is developed by Robin Berthier. Robin provided extensive details regarding his project. He indicated that Nfsight was born from the need to easily retrieve a list of all the active servers in a given network. Network operators and security administrators are always looking for this information in order to maintain up-to-date documentation of their assets and to rapidly detect rogue hosts. As mentioned above, it made sense to extract this information from NetFlow data for practicality and scalability. Robin pointed out that NetFlow is already deployed in most networks and offers a passive and automated way to explore active hosts even in extremely large networks (such as the spectacularly massive Microsoft datacenter environment I work in). The primary challenge in designing and implementing Nfsight lay in accurately identifying clients and servers from omnidirectional NetFlow records given that NetFlow doesn't keep track of client/server sessions; a given interaction between two hosts will lead to two separate NetFlow records. Nfsight is designed to pair the right records and to identify which host initiated the connection and does so through a set of heuristics that are combined with a Bayesian inference algorithm. Robin pointed out that timing (which host started the connection) and port numbers (which host has a higher port number) are two examples of heuristics used to differentiate client from server in bidirectional flows. He also stated that the advantage of Bayesian inference is to converge towards a more accurate identification as evidence is collected over time from the different heuristics. As a result, Nfsight gains a comprehensive understanding of active servers in a network after only few hours.
Another important Nfsight feature is the visual interface that allows operators to query and immediately display the results through any Web browser. One can, as an example, query for all the SSH servers.
“The tool will show a matrix where each row is a server (IP address and port/service) and each column is a timeslot. The granularity of the timeslot can be configured to represent a few minutes, an hour, or a day. Each cell in the matrix shows the activity of the server for the specific time period. Operators instantly assess the nature and volume of client/server activity through the color and the brightness of the colored cell. Those cells can even show the ratio of successful to unsuccessful network sessions through the red color. This enables operators to identify scanning behavior or misconfiguration right away. This feature was particularly useful during an attack against SSH servers recorded in a large academic network. As shown on the screenshot below, the green cells represent normal SSH server activity and suddenly, red/blue SSH client activity starts, indicating a coordinated scan.”

FIGURE 1: Nfsight encapsulates attack against SSH servers
Robin described the investigation of the operating systems on those SSH servers where the sysadmins found that they were using a shared password database that an attacker was able to compromise. The attacker then installed a bot in each of the server, and launched a scanning campaign from each compromised server. Without the visual representation provided by Nfsight, it would have taken much longer to achieve situational awareness, or worse, the attack could have gone undetected for days.
I am here to tell you, dear reader, with absolute experiential certainty, that this methodology works at scale for identifying malicious or problematic traffic, particularly when compared against threat feeds such as those provided by Collective Intelligence Framework. Think about it from the perspective of detecting evil for cloud services operators and how to do so effectively at scale. Tools such as Nfdump, Nfsen, and Nfsight start to really make sense.

Preparing your system for Nfsight

Now that you’re all excited, I will spend a good bit of time on installation as I drew from a number of sources to achieve an effective working base for part one of our three part series of C3CM. This is laborious and detailed so pay close attention. I started working from an Ubuntu Desktop 12.04 LTS virtual machine I keep in my collection, already configure with Apache and MySQL. One important distinction here. I opted to not spin up my old Cisco Catalyst 3500XL in my lab as it does not support NetFlow and instead opted to use fprobe to generate flows right on my Ubuntu instance being configured as an Nfsen/Nfsight collector. This is acceptable in a low volume lab like mine but won’t be effective in any production environment. You’ll be sending flows from supported devices to your Nfsen/Nfsight collector(s) and defining them explicitly in your Nfsen configuration as we’ll discuss shortly. Keep in mind that preconfigured distributions such as Network Security Toolkit come with the like of Nfdump and Nfsen already available but I wanted to start from scratch with a clean OS so we can build our own C3CM host during this three part series.
From your pristine Ubuntu instance, begin with a system update to ensure all packages are current: sudo apt-get update && sudo apt-get upgrade.
You can configure the LAMP server during VM creation from the ISO or do so after the fact with sudo apt-get install taskselthen sudo tasksel and select LAMP server.
Install the dependencies necessary for Nfsen and Nfsight: sudo apt-get install rrdtool mrtg librrds-perl librrdp-perl librrd-dev Nfdump libmailtools-perl php5 bison flex librrds-perl libpcap-dev libdbi-perl picviz fprobe. You’ll be asked two question during this stage of the install.  The fprobe install will ask which interface to capture from; typically the default is eth0. For Collector address, respond with localhost:9001. You can opt for a different port but we’ll use 9001 later when configuring the listening component of Nfsen. During the mrtg install, when prompted to answer “Make /etc/mrtg.cfg owned by and readable only by root?" answer Yes.
The Network Startup Resource Center (NSRC) conducts annual workshops; in 2012 during their Network Monitoring and Managements event Nfsen installation was discussed at length. Following their guidance:

Install and configure Nfsen:
cd /usr/local/src
sudo wget "http://sourceforge.net/projects/nfsen/files/latest/download " -O nfsen.tar.gz
sudo tar xvzf nfsen.tar.gz
cd nfsen-1.3.6p1
cd etc
sudo cp nfsen-dist.conf nfsen.conf
sudo gedit nfsen.conf
Set the $BASEDIR variable: $BASEDIR="/var/nfsen";
Adjust the tools path to where items actually reside:
# Nfdump tools path
$PREFIX = '/usr/bin';
Define users for Apache access:
$WWWUSER = 'www-data';
$WWWGROUP = 'www-data';
Set small buffer size for quick data rendering:
# Receive buffer size for nfcapd
$BUFFLEN = 2000;
Find the %sources definition, and modify as follows (same port number as set in fprobe install):
%sources=(
'eth0' => {'port'=>'9001','col'=>'#0000ff','type'=>'netflow'},
);
Save and exit gedit.

Create the NetFlow user on the system:
sudo useradd -d /var/netflow -G www-data -m -s /bin/false netflow

Initialize Nfsen:
cd /usr/local/src/nfsen-1.3.6p1
sudo ./install.pl etc/nfsen.conf
sudo /var/nfsen/bin/nfsen start
You may notice errors that include pack_sockaddr_in6 and unpack_sockaddr_in6; these can be ignored.
Run sudo /var/nfsen/bin/nfsen status to ensure that Nfsen is running properly.

Install the Nfsen init script:
sudo ln -s /var/nfsen/bin/nfsen /etc/init.d/nfsen
sudo update-rc.d nfsen defaults 20

You’re halfway there now. Check your Nfsen installation via your browser.
Note: if you see a backend version mismatch message, incorporate the changes into nfsen.php as noted in this diff file. As data starts coming in (you can force this with a ping –t (Windows) of your Nfsen collector IP and/or an extensive Nmap scan) you should see results similar to those seen from the Details tab in Figure 2 (allow it time to populate).

FIGURE 2: Nfsen beginning to render data

Install Nfsight, as modified from Steronius’ Computing Bits (follow me explicitly here):
cd /usr/local/src
sudo wget "http://sourceforge.net/projects/nfsight/files/latest/download" -O nfsight.tar.gz
sudo tar xvzf nfsight.tar.gz
cd nfsight-beta-20130323
sudo cp backend/nfsight.pm /var/nfsen/plugins/
sudo mkdir /var/www/html/nfsen/plugins/nfsight
sudo chgrp -R www-data /var/www/nfsen/plugins/nfsight
sudo mkdir /var/www/nfsen/nfsight
sudo cp -R frontend/* /var/www/nfsen/nfsight/
sudo chgrp -R www-data /var/www/nfsen/nfsight/
sudo chmod g+w /var/www/nfsen/nfsight/
sudo chmod g+w /var/www/nfsen/plugins/nfsight/
sudo chmod g+w /var/www/nfsen/nfsight/cache
sudo chmod g+x /var/www/nfsen/nfsight/bin/biflow2picviz.pl

Create Nfsight database:
Interchange the root user with an Nfsight database user if you’re worried about running the Nfsight db with root.
mysql -u root –pand enter your MySql root password
mysql> CREATE DATABASE nfsight
mysql> GRANT ALL PRIVILEGES ON nfsight.* TO root@'%' IDENTIFIED BY '';
mysql> grant all privileges on nfsight.* TO root@localhost IDENTIFIED BY '';
mysql> GRANT ALL PRIVILEGES ON nfsight.* TO 'root'@'%' WITH GRANT OPTION;
mysql> FLUSH PRIVILEGES;
mysql> quit
Launch the Nfsight web installer; on my server the path is:
http://192.168.42.131/nfsen/nfsight/installer.php
The proper paths for our installation are:
URL = /nfsen/nfsight/
Path to data files = /var/www/nfsen/plugins/nfsight
You may need to edit detail.php to ensure proper paths for grep, cat, and pcv. They should read as follows:
/bin/grep
/bin/cat
/usr/bin/pcv
Edit /var/nfsen/etc/nfsen.conf with settings from the Nfsight installer.php output as seen in Figure 3.

FIGURE 3: Configure nfsen.conf for Nfsight
Restart Nfsen:
/var/nfsen/bin/nfsen stop
/var/nfsen/bin/nfsen start
Check status: /var/nfsen/bin/nfsen status

Last step! Install the hourly cronjob required by Nfsight to periodically update the database:
crontab -e
06 * * * *  /usr/bin/wget --no-check-certificate -q -O - http://management:aggregate@127.0.0.1/nfsen/nfsight/aggregate.php
Congratulations, you should now be able to login to Nfsight! The credentials to login to Nfsight are those you defined when running the Nfsight installer script (installer.php). On my server, I do so at http://192.168.42.131/nfsen/nfsight/index.php.

Nfsight in flight

After all that, you’re probably ready to flame me with a “WTF did you just make me do, Russ!” email. I have to live up to being the tool in toolsmith, right? I’m with you, but it will have been worth it, I promise. As flows begin to populate data you’ll have the ability to drill into specific servers, clients, and services. I generated some noisy traffic against some Microsoft IP ranges that I was already interested in validating which in turn gave the impression of a host on my network scanning for DNS servers. Figure 4 show an initial view where my rogue DNS scanner shows up under Top 20 active internal servers.

FIGURE 4: Nfsight’s Top 20
You can imagine how, on a busy network, these Top 20 views could be immediately helpful in identifying evil egress traffic. If you click on a particular IP in a Top 20 view you’ll be treated to service activity in a given period (adjustable in three hour increments). You can then drill in further by 5 minute increments as seen in Figure 5 where you’ll note all the IPs my internal hosts was scanning on port 53. You can also render a parallel plot (courtesy of PicViz installed earlier). Every IPv4 octet, port number, and service are hyperlinks to more flow data, so just keep on clicking. When you click a service port number and it offers you information about a given port, thanks to the SANS Internet Storm Center as you are directed to the ISC Port Report for that particular service when you click the resulting graph.
See? I told you it would be worth it.

FIGURE 5: Nfsight Activity Overview
All functionality references are available on the Wiki, must importantly recognize that the color codes are red for unanswered scanner activity, blue for client activity, and green for server activity.
You can select save this view and create what will then be available as an event in the Nfsight database. I saved one from what you see in Figure 5 and called it Evil DNS Egress. These can then be reloaded by clicking Events from the upper right-hand corner of the Nfsight UI.
Nfsight also includes a flow-based intrusion detection system called Nfids, still considered a work in progress. Nfids will generate alerts that are stored in a database and aggregated over time, and alerts that are recorded more than a given number of time are reported to the frontend. These alerts are generated based on five heuristic categories including: malformed, one-to-many IP, one-to-many port, many-to-one IP, and many-to-one port.
You can also manage your Nfsight settings from this region of the application, including Status, Accounts, Preferences, Configuration, and Logs. You can always get back to the home page by simply clicking Nfsight in the upper-left corner of the UI.
As the feedback on the Nfsight SourceForge site says, “small and efficient and gets the job done.”

In Conclusion

Recall from the beginning of this discussion that I’ve defined C3CM as methods by which to identify, interrupt, and counter the command, control, and communications capabilities of our digital assailants
Nfsight, as part of our C3CM concept, represents the first step (and does a heck of a good job doing it) of my C3CM process: identify. Next month we’ll discuss the interrupt phase of C3CM using BroIDS and Logstash.
Ping me via email if you have questions (russ at holisticinfosec dot org).
Cheers…until next month.

Acknowledgements

Robin Berthier, Nfsight developer


C3CM: Part 2 – Bro with Logstash and Kibana

$
0
0
Prerequisites
Linux OS –Ubuntu Desktop 12.04 LTS discussed herein

Introduction
In Part 1 of our C3CM discussion we established that, when applied to the practice of combating bots and APTs, C3CM can be utilized to identify, interrupt, and counter the command, control, and communications capabilities of our digital assailants. 
Where, in part one of this three part series, we utilized Nfsight with Nfdump, Nfsen, and fprobe to conduct our identification phase, we’ll use Bro, Logstash, and Kibanaas part of our interrupt phase. Keep in mind that while we’re building our own Ubuntu system to conduct our C3CM activities you can perform much of this work from Doug Burks' outstanding Security Onion (SO). You’ll have to add some packages such as those we did for Part 1, but Bro as described this month is all ready to go on SO. Candidly, I’d be using SO for this entire series if I hadn't already covered it in toolsmith, but I’m also a firm believer in keeping the readership’s Linux foo strong as part of tool installation and configuration. The best way to learn is to do, right?
That said, I can certainly bring to your attention my latest must-read recommendation for toolsmith aficionados: Richard Bejtlich’s The Practice of Network Security Monitoring. This gem from No Starch Press covers the life-cycle of network security monitoring (NSM) in great detail and leans on SO as its backbone. I recommend an immediate download of the latest version of SO and a swift purchase of Richard’s book.
Bro has been covered at length by Doug, Richard in his latest book, and others, so I won’t spend a lot of time on Bro configuration and usage. I’ll take you through a quick setup for our C3CM VM but the best kickoff point for your exploration of Bro, if you haven’t already been down the path to enlightenment, is Kevin Liston’s Internet Storm Center Diary post Why I Think You Should Try Bro. You’ll note as you read the post and comments that SO includes ELSA as an excellent “front end” for Bro and that you can be up and running with both when using SO. True (and ELSA does rock), but our mission here is to bring alternatives to light and heighten awareness for additional tools. As Logstash may be less extensively on infosec’s radar than Bro, I will spend a bit of time on its configuration and capabilities as a lens and amplifier for Bro logs. Logstash comes to you courtesy of Jordan Sissel. As I was writing this, Elasticsearch announced that Jordan will be joining them to develop Logstash with the Elasticsearch team. This is a match made in heaven and means nothing but good news for us from the end-user perspective. Add Kibana (also part of the Elasticsearch family) and we have Bro log analysis power of untold magnitude. To spell it all out for you, per the Elasticsearch site, you know have at your disposal, a “fully open source product stack for logging and events management: Logstash for log processing, Elasticsearch as the real time analytics and search engine, and Kibana as the visual front end.” Sweet!
 
Bro

First, a little Bro configuration work as this is the underpinning of our whole concept. I drew from Kevin Wilcox’s Open-Source Toolbox for a quick, clean Bro install. If you plan to cluster or undertake a production environment-worthy installation you’ll want to read the formal documentation and definitely do more research.
You’ll likely have a few of these dependencies already met but play it safe and run:
sudo apt-get install cmake make gcc g++ flex bison libpcap-dev libssl-dev python-dev swig zlib1g-dev libmagic-dev libgoogle-perftools-dev libgeoip-dev
Grab Bro: wget http://www.bro-ids.org/downloads/release/bro-2.1.tar.gz
Unpack it: tar zxf bro-2.1.tar.gz
CD to the bro-2.1 directory and run ./configure then make and finally sudo make install.
Run sudo visudoand add :/usr/local/bro/bin (inside the quotation marks) to the secure_pathparameter to the end of the line the save the file and exit. This ensures that broctl, the Bro control program is available in the path.
Run sudo broctland Welcome to BroControl 1.1should pop up, then exit.
You’ll likely want to add broctl start to /etc/rc.local so Bro starts with the system, as well as add broctl cron to /etc/crontab.
There are Bro config files that warrant your attention as well in /usr/local/bro/etc. You’ll probably want have Bro listen via a promiscuous interface to a SPAN port or tapped traffic (NSA pickup line: “I’d tap that.” Not mine, but you can use it J). In node.cfg define the appropriate interface. This is also where you’d define standalone or clustered mode. Again keep in mind that in high traffic environments you’ll definitely want to cluster. Set your local networks in networks.cfgto help Bro understand ingress versus egress traffic. In broctl.cfg, tune the mail parameters if you’d like to use email alerts.
Run sudo broctl and then execute install, followed by start, then status to confirm you’re running. The most important part of this whole effort is where the logs end up given that that’s where we’ll tell Logstash to look shortly. Logs are stored in /usr/local/bro/logs by default, and are written to event directories named by date stamp. The most important directory however is /usr/local/bro/logs/current; this is where we’ll have Logstash keep watch. The following logs are written here, all with the .log suffix: communication, conn, dns, http, known_hosts, software, ssl, stderr, stdout, and weird.

Logstash

Logstash requires a JRE. You can ensure Java availability on our Ubuntu instance by installing OpenJDK via sudo apt-get install default-jre. If you prefer, install Oracle’s version then define your preference as to which version to use with sudo update-alternatives --config java. Once you’ve defined your selection java –version will confirm.
Logstash runs from a single JAR file; you can follow Jordan’s simple getting started guide and be running in minutes. Carefully read and play with each step in the guide, including saving to Elasticsearch, but use my logstash-c3cm.conf config file that I’ve posted to my site for you as part of the running configuration you’ll use. You’ll invoke it as follows (assumes the Logstash JAR and the conf file are in the same directory):
java -jar logstash-1.1.13-flatjar.jar agent -f logstash-c3cm.conf -- web --backend elasticsearch://localhost/
The result, when you browse to http://localhost:9292/search is a user interface that may remind you a bit of Splunk. There is a lot of query horsepower available here. If you’d like to search all entries in the weird.log as mentioned above, execute this query:
* @source_path:"//usr/local/bro/logs/current/weird.log"
Modify the log type to your preference (dns, ssl, etc) and you’re off to a great start. Weird.log includes “unusual or exceptional activity that can indicate malformed connections, traffic that doesn’t conform to a particular protocol, malfunctioning/misconfigured hardware, or even an attacker attempting to avoid/confuse a sensor” and notice.log will typically include “potentially interesting, odd, or bad” activity. Click any entry in the Logstash UI and you’ll see a pop-up window for “Fields for this log”. You can drill into each field for more granular queries and you can also drill in the graph to zoom into time periods as well. Figure 1 represents a query of weird.log in a specific time window.

FIGURE 1: Logstash query power
There is an opportunity to create a Bro plugin for Logstash, it’s definitely on my list.
Direct queries are excellent, but you’ll likely want to create dashboard views to your Bro data, and that’s where Kibana comes in.

Kibana

Here’s how easy this is. Download Kibana, unpack kibana-master.zip, rename the resulting directory to kibana, copy or move it to /var/www, edit config.js such that instead of localhost:9200 for the elasticsearchparameter, it’s set to the FQDN or IP address for the server, even if all elements are running on the same server as we are doing here. Point your browser to http://localhost/kibana/index.html#/dashboard/file/logstash.jsonand voila, you should see data. However, I’ve exported my dashboard file for you. Simply save it to /var/www/kibana/dashboardsthen click the open-folder icon in Dashboard Control and select C3CMBroLogstash.json. I’ve included one hour trending and search queries for each of the interesting Bro logs. You can tune these to your heart’s content. You’ll note the timepicker panel in the upper left-hand corner. Set auto-refresh on this and navigate over time as you begin to collect data as seen in Figure 2 where you’ll note a traffic spike specific to an Nmap scan.

FIGURE 2: Kibana dashboard with Nmap spike
Dashboards are excellent, and Kibana represents a ton of flexibility in this regard, but you’re probably asking yourself “How does this connect with the Interrupt phase of C3CM?” Bro does not serve as a true IPS per se, but actions can be established to clearly “interrupt control and communications capabilities of our digital assailants.” Note that one can use Bro scripts to raise notices and create custom notice actions per Notice Policy. Per a 2010 write-up on the Security Monks blog, consider Detection Followed By Action. “Bro policy scripts execute programs, which can, in turn, send e-mail messages, page the on-call staff, automatically terminate existing connections, or, with appropriate additional software, insert access control blocks into a router’s access control list. With Bro’s ability to execute programs at the operating system level, the actions that Bro can initiate are only limited by the computer and network capabilities that support Bro.” This is an opportunity for even more exploration and discovery; should you extend this toolset to create viable interrupts (I’m working on it but ran out of time for this month’s deadline), please let us know via comments or email.

In Conclusion

Recall from the beginning of this discussion that I've defined C3CM as methods by which to identify, interrupt, and counter the command, control, and communications capabilities of our digital assailants.
With Bro, Logstash, and Kibana, as part of our C3CM concept, the second phase (interrupt) becomes much more viable: better detection leads to better action. Next month we’ll discuss the counter phase of C3CM using ADHD (Active Defense Harbinger Distribution) scripts.
Ping me via email if you have questions (russ at holisticinfosec dot org).
Cheers…until next month.

Joomla vulnerabilities & responsible disclosure: when being pwned is a positive

$
0
0
First, major kudos and thanks to Almas Malik, @AlmasMalik07, aka Code Smasher, who was kind enough to report to me the fact that my Joomla instance was vulnerable to CVE-2013-5576. His proof of concept was dropped to my /images directory as seen just below. :-)
Thank you, Almas, much appreciated and keep up the good work at http://www.hackingsec.in/.
That said, for all intents and purposes, I haz been pwned. :-(

Diving into the issue a bit:
Joomla versions prior to 2.5.14 and 3.1.5 are prone to a vulnerability that allows arbitrary file uploads. The issue occurs, of course, because the application fails to adequately sanitize user-supplied input. As it turns out in my case, an attacker may leverage this issue to upload arbitrary files to the affected system, possibly resulting in arbitrary code execution within the context of the vulnerable application.
The fact that holisticinfosec.org fell victim to this is frustrating as I had applied the 2.5.14 update almost immediately after it was released, and yet, quite obviously, it had not been successful applied. Be that a PEBKAC issue or something specific to the manner in which the patch was applied (I used the Joomla administrative portal update feature), I did not validate the results by testing the vulnerability before and after updating. The Metasploit module for this vuln works quite nicely, yet I didn't use it on myself. Doh!  As a result , as no fewer than three (two hostile, one responsible (Almas)) different entities did so for me after the vulnerability became well known and easily exploitable. As a result of my own lack of manual validation ex post facto, I know have the pleasure of Zone-H, Hack-DB, and VirusTotal entries.
On 20 and 21 AUG 2013, rain.txt was dropped courtesy of RainsevenDotMy and z.txt thanks to the Indonesian Cyber Army. Why the sudden interest from Malaysian and Indonesian hacktivists, other than my leaving such low hanging fruit out there for the taking, I cannot say.


The only bonus for me was the fact that my allowed file and MIME-type upload settings prevented anything but image or text files to be uploaded. As a result, no PHP backdoor shells; I'm thankful for that upside.
The reality is that you should upload files via FTP/SFTP and disable use of the Joomla uploader if at all possible. Definitely check your permissions settings and lock them down as much as you possibly can. Clearly I suck at administering Joomla or we wouldn't be having this conversation. While tools such as Joomla are wonderful for ease of use and convenience, as always, your personal Interwebs are only as strong as your weakest link. Patch fast, patch often: Joomla does an excellent job of timely and transparent security updates.

Following is an example log entry specific to the attack:
202.152.201.176 - - [20/Aug/2013:23:46:44 -0600] "POST /index.php?option=com_media&task=file.upload&tmpl=component&13be59a364339033944efaed9643ff7b=m4okdrsoa26agbebn1g0kmsh72&9f6534d02839c15e08087ddebdc0f835=1&asset=com_content&author=&view=images&folder= HTTP/1.1" 303 901 "http://holisticinfosec.org/index.php?option=com_media&view=images&tmpl=component&fieldid=&e_name=jform_articletext&asset=com_content&author=&folder=""Mozilla/5.0 (Windows NT 6.1) AppleWebKit/537.36 (KHTML, like Gecko) Chrome/28.0.1500.95 Safari/537.36"

Recommendations for Joomla users:
1) Update to 2.5.14 and 3.1.5, and confirm that the update was applied correctly.
2) Review your logs from 1 AUG 2013 to date. Use file.upload as a keyword in POST requests.
3) Check your images directory for the presence of TXT or PHP files that clearly shouldn't be there.
4) Take advantage of security services such as antimalware and change monitoring.
5) Monitor search engines for entries specific to your domains at sites such as Zone-H, Hack-DB, and VirusTotal.
6) To the tune of the William Tell Overture: read your logs, read your logs, read your logs, logs, logs.

While I'm bummed that I'm reminding myself of the very lessons I've reminded others of for years, I'm glad to share findings in the context of responsible disclosure and to reiterate the lessons learned.
Thanks again to @AlmasMalik07 for the heads up and PoC.


C3CM: Part 3 – ADHD: Active Defense Harbinger Distribution

$
0
0
Prerequisites
Linux OS –Ubuntu Desktop 12.04 LTS discussed herein

Introduction
In Parts 1 & 2 of our C3CM discussion covered the identify and interrupt phases of the process I’ve defined as an effort to identify, interrupt, and counter the command, control, and communications capabilities of our digital assailants.In Part 3 I’m going to cover…hey, a squirrel! J In this, the final part of our series, I’ll arm you for the interrupt phase with ADHD…no, not that; rather, it’s the Active Defense Harbinger Distribution. You know how I know I have ADHD? My wife asked me for a glass of water and I made myself coffee instead. Wait, maybe that’s just selfish…er, nevermind.
I hope you’ve enjoyed utilizing Nfsight with Nfdump, Nfsen, and fprobe for our identificationphase and BroIDS (Bro), Logstash, and Kibana as part of our interrupt phase. But I have to say, I think the fun really kicks in here when we consider how to counter our ne’er-do-well denizens of digital destruction. We’ll install the ADHD scripts on the C3CM Ubuntu system we’ve been building in Parts 1 and 2 but, much as you could have performed the interrupt phase using Doug Burk’s Security Onion (SO), you could download the full ADHD distribution and take advantage of it in its preconfigured splendor to conduct the counter phase. The truth of the matter is that running all the tools we’ve implemented during this C3CM campaign on one VM or physical machine, all at the same time, would be silly as you’d end up with port contention and resource limitations. Consider each of the three activities (identify, interrupt, and counter) as somewhat exclusive. Perhaps, clone three copies of the C3CM VM once we’re all finished and conduct each phase uniquely or simply do one at a time. The ADHD distribution (absolutely download it and experiment in addition to this activity) is definitely convenient and highly effective but again, I want you to continue developing your Linux foo, so carry on in our C3CM build out.
John Strand and Ethan Robish are the ADHD project leads, and Ethan kindly gave us direct insight into the project specific to the full distribution:
"ADHD is an ongoing project that features many tools to counter an attacker's ability to exploit and pivot within a network.  Tools such as Honey Badger, Pushpin, Web Bug Server, and Decloak provide a way of identifying an attacker's remote location, even if he has attempted to hide it.  Artillery, Nova, and Weblabyrinth, along with a few shell scripts provide honeypot-like functionality to confuse, disorient, and frustrate an attacker.  And then there are the well-known tools that help the good guys turn the tables on the attacker: the Social Engineering Toolkit (SET), the Browser Exploitation Framework (BeEF), and the Metasploit Framework (MSF).
Future plans for the project include the typical updates along with the addition of new tools.  Since the last release of ADHD, there has been some interesting research done by Chris John Riley on messing with web scanners.  His preliminary work was included with ADHD 0.5.0 but his new work will be better integrated and documented with the next release of ADHD.  We also plan to dive more into the detection of people that try to hide their identities behind proxies and other anonymizing measures.  Further down the line you may see some big changes to the underlying distribution itself.  We have started on a unified web control interface that will allow users of ADHD to control the various aspects of the system, as well as begun exploring how to streamline installation of both ADHD itself and the tools that are included.  Our goal is to make it as simple as possible to install and configure ADHD to run on your own network."
Again, we’re going to take, Artillery, Beartrap, Decloak, Honey Badger, Nova, Pushpin, Spidertrap, Web Bug Server, and Weblabyrinth and install them on our C3CM virtual machine as already in progress per Parts 1 and 2 of the series. In addition to all of Ethan’s hard work on Spidertrap, Web Bug Server, and Weblabyrinth, it’s with much joy that I’d like to point out that some of these devious offerings are devised by old friends of toolsmith. Artillery is brought to you by TrustedSec. TrustedSec is brought to you by Dave Kennedy (@dave_rel1k). Dave Kennedy brought us Social-Engineer Toolkit (SET) in February 2013 and March 2012 toolsmiths. Everyone loves Dave Kennedy.
Honey Badger and Pushpin are brought to you by @LaNMaSteR53. LaNMaSteR53 is Tim Tomes, who also works with Ethan and John at Black Hills Information Security. Tim Tomes brought us Recon-ng in May 2013’s toolsmith. Tim Tomes deserves a hooah. Hooah! The information security community is a small world, people. Honor your friends, value your relationships, watch each other’s backs, and praise the good work every chance you get.
Let’s counter, shall we? 

ADHD installation tips

Be sure to install git on your VM via sudo apt-get install git, execute mkdir ADHD, then cd ADHD, followed by one big bundle of git cloning joy (copy and paste this big boy as a whole):
git clone https://github.com/trustedsec/artillery/ artillery/&git clone https://github.com/chrisbdaemon/BearTrap/ BearTrap/&git clone https://bitbucket.org/ethanr/decloak decloak/&git clone https://bitbucket.org/LaNMaSteR53/honeybadger honeybadger/&git clone https://bitbucket.org/LaNMaSteR53/pushpin pushpin/&git clone https://bitbucket.org/ethanr/spidertrap spidertrap/&git clone https://bitbucket.org/ethanr/webbugserver webbugserver/&git clone https://bitbucket.org/ethanr/weblabyrinth weblabyrinth/
Nova is installed as a separate process as it’s a bigger app with a honeyd dependency. I’m hosting the installation steps on my website but to grab Nova and Honeyd issue the following commands from your ADHD directory:
git clone git://github.com/DataSoft/Honeyd.git   
git clone git://github.com/DataSoft/Nova.git Nova
cd Nova
git submodule init
git submodule update
The ADHD SourceForge Wiki includes individual pages for each script and details regarding their configuration and use. We’ll cover highlights here but be sure to read each in full for yourself.

ADHD

I’ve chosen a select couple of ADHD apps to dive in to starting with Nova.
Nova is an open-source anti-reconnaissance system designed to deny attackers access to real network data while providing false information regarding the number and types of systems connected to the network. Nova prevents and detects snooping by deploying realistic virtualized decoys while identifying attackers via suspicious communication and activity thus providing sysadmins with better situational awareness. Nova does this in part with haystacks, as in find the needle in the.
Assuming you followed the Nova installation guidance provided above, simply run quasarat a command prompt then browse to https://127.0.0.1:8080. Login with username nova and password toor. You’ll be prompted with the Quick Setup Wizard, do not use it.
From a command prompt execute novacli start haystack debug to ensure Haystack is running.
Click Haystacks under Configuration in the menu and define yourself a Haystack as seen in Figure 1.

FIGURE 1: Nova Haystack configuration
You can also add Profiles to emulate hosts that appear to attackers as very specific infrastructure such as a Cisco Catalyst 3500XL switch as seen in Figure 2.

FIGURE 2: Nova Profile configuration
Assuming Packet Classifier and Haystack status show as online, you can click Packet Classifier from the menu and begin to see traffic as noted in Figure 3.

FIGURE 3: Nova Packet Classifier (traffic overview)
What’s really cool here is that you can right-click on a suspect and train Nova to identify that particular host as malignant or benign per Figure 4.

FIGURE 4: Nova training capabilities
Over time training Nova will create a known good baseline for trusted hosts and big red flags for those that are evil. As you can see in Figure 5, you’ll begin to see Honeyd start killing attempted connections based on what it currently understands as block-worthy. Use the training feature to optimize and tune to your liking.

FIGURE 5: Honeyd killing attempted connections
Nova’s immediately interesting and beneficial; you’ll discern useful results very quickly.

The other ADHD app I find highly entertaining is Spider Trap. I come out on both sides of this argument. On one hand, until very recently I worked in the Microsoft organization that operates Bing. On the other hand, as website operator, I find crawler & spider traffic annoying and excessive (robots.txt is your friend assuming it’s honored). Bugs you too and you want to get a little payback? Expose Spider Trap where you know crawlers will land, either externally for big commercial crawlers, or internally where your pentesting friends may lurk. It’s just a wee Python script and you can run as simply as python2 spidertrap.py. I love Ethan’s idea to provide Spider Trap with a list of links. He uses the big list from OWASP DirBuster like this, python2 spidertrap.py DirBuster-Lists/directory-list-2.3-big.txt, but that could just as easily be any text list. Crawlers and spiders will loop ad infinitum achieving nothing. Want to blow an attacker or pentester’s mind? Use the list of usernames pulled from /etc/passwdI’ve uploaded for you as etcpasswd.txt.  Download etcpasswd.txtto the Spider Trap directory, then add the following after line 66 of spidertrap.py:
#Attacker/pentester misdirect
self.wfile.write("/etc/passwd")
Then run it like this: python2 spidertrap.py etcpasswd.txt.
The result will be something that will blow a scanner or manual reviewer’s mind. They’ll think they’ve struck pay dirt and have some weird awesome directory traversal bug at hand as seen in Figure 6.

FIGURE 6: Spider Trap causing confusion
Spider Trap runs by default on port 8000 but if you want to run it on 80 or something else just edit the script. Keep in mind if will fight with Apache if you try to use 80 and don’t service apache2 stop.
You can have a lot of fun at someone else’s expense with ADHD. Use it well, use it safely, but enjoy the prospect of countering your digital assailants in some manner.

In Conclusion

In closing, for this three part series I’ve defined C3CM as methods by which to identify, interrupt, and counter the command, control, and communications capabilities of our digital assailants.
With ADHD, the counter phase of our C3CM concept, is not only downright fun, but it becomes completely realistic to imagine taking active (legal) steps in defending your networks. ADHD gives me the energy to do anything and the focus to do nothing. Wait…never mind. Next month we’ll discuss…um, I can’t decide so you get to help!
For November, to celebrate seven years of toolsmith, which of the following three topics should toolsmith cover?
2)  Mantra vs. Minion 
Tweet your choice to me via @holisticinfosec and email if you have questions regarding C3CM via russ at holisticinfosec dot org.
Cheers…until next month.

Acknowledgements

John Strand and Ethan Robish, Black Hills Information Security

toolsmith: OWASP Xenotix XSS Exploit Framework

$
0
0
Prerequisites
Current Windows operating system

Introduction
Hard to believe this month’s toolsmith marks seven full years of delivering dynamic content and covering timely topics on the perpetually changing threat-scape information security practitioners face every day. I’ve endeavored to aid in that process 94 straight months in a row, still enjoy writing toolsmith as much as I did day one, and look forward to many more to come. How better to roll into our eighth year than by zooming back to one of my favorite topics, cross-site scripting (XSS), with the OWASP Xenotix XSS Exploit Framework. I’d asked readers and Twitter followers to vote for November’s topic and Xenotix won by quite a majority. This was timely as I’ve also seen renewed interest in my Anatomy of an XSS Attackpublished in the ISSA Journal more than five years ago in June 2008. Hard to believe XSS vulnerabilities still prevail but according to WhiteHat Security’s May 2013 Statistics report:
1)      While no longer the most prevalent vulnerability, XSS is still #2 behind only Content Spoofing
2)      While 50% of XSS vulnerabilities were resolved, up from 48% in 2011, it still took an average of 227 for sites to deploy repairs
Per the 2013 OWASP Top 10, XSS is still #3 on the list. As such, good tools for assessing web applications for XSS vulnerabilities remain essential, and OWASP Xenotix XSS Exploit Framework fits the bill quite nicely.
Ajin Abraham (@ajinabraham) is Xenotix’s developer and project lead; his feedback on this project supports the ongoing need for XSS awareness and enhanced testing capabilities.
According to Ajin, most of the current pool of web application security tools still don't give XSS the full attention it deserves, an assertion he supports with their less than optimal detection rates and a high number of false positive. He has found that most of these tools use a payload database of about 70-150 payloads to scan for XSS. Most web application scanners, with the exception of few top notch proxies such as OWASP ZAP and Portswigger’s Burp Suite, don't provide much flexibility especially when dealing with headers and cookies. They typically have a predefined set of protocols or rules to follow and from a penetration tester’s perspective can be rather primitive. Overcoming some of these shortcomings is what led to the OWASP Xenotix XSS Exploit Framework.
Xenotix is a penetration testing tool developed exclusively to detect and exploit XSS vulnerabilities. Ajin claims that Xenotix is unique in that it is currently the only XSS vulnerability scanner with zero false positives. He attributes this to the fact that it uses live payload reflection-based XSS detection via its powerful triple browser rendering engines, including Trident, WebKit and Gecko. Xenotix apparently hasthe world's second largest XSS payload database, allowing effective XSS detection and WAF bypass. Xenotix is also more than a vulnerability scanner as it also includes offensive XSS exploitation and information gathering modules useful in generating proofs of concept.
For feature releases Ajin intends to implement additional elements such as an automated spider and an intelligent scanner that can choose payloads based on responses to increase efficiency and reduce overall scan time. He’s also working on an XSS payload inclusive of OSINT gathering which targets certain WAF's and web applications with specific payloads, as well as a better DOM scanner that works within the browser. Ajin welcomes support from the community. If you’re interested in the project and would like to contribute or develop, feel free to contact him via @ajinabraham, the OWASP Xenotix site, or the OpenSecurity site.

Xenotix Configuration

Xenotix installs really easily. Download the latest package (4.5 as this is written), unpack the RAR file, and execute Xenotix XSS Exploit Framework.exe. Keep in mind that antimalware/antivirus on Windows systems will detect xdrive.jar as a Trojan Downloader. Because that’s what it is. ;-) This is an enumeration and exploitation tool after all. Before you begin, watch Ajin’s YouTube videoregarding Xenotix 4.5 usage. There is no written documentation for this tool so the video is very helpful. There are additional videos for older editions that you may find useful as well. After installation, before you do anything else, click Settings, then Configure Server, check the Semi Persistent Hook box, then click Start. This will allow you to conduct information gathering and exploitation against victims once you’ve hooked them.
Xenotix utilizes the Trident engine (Internet Explorer 7), the Webkit engine (Chrome 25), and the Gecko engine (Firefox 18), and includes three primary module sets: Scanner, Information Gathering, and XSS Exploitation as seen in Figure 1.

FIGURE 1: The Xenotix user interface
We’ll walk through examples of each below while taking advantage of intentional XSS vulnerabilities in the latest release of OWASPMutillidae II: Web Pwn in Mass Production. We covered Jeremy Druin’s (@webpwnized) Mutillidae in August 2012’s toolsmith and it’s only gotten better since.

Xenotix Usage

These steps assume you’ve installed Mutillidae II somewhere, ideally on a virtual machine, and are prepared to experiment as we walk through Xenotix here.
Let’s begin with the Scannermodules. Using Mutillidae’s DNS Lookupunder OWASP Top 10àA2 Cross Site Scripting (XSS)àReflected (First Order)àDNS Lookup. The vulnerable GET parameter is page and on POST is target_host. Keep in mind that as Xenotix will confirm vulnerabilities across all three engines, you’ll be hard pressed to manage output, particularly if you run in Auto Mode; there is no real reporting function with this tool at this time. I therefore suggest testing in ManualMode. This allows you to step through each payload and as seen Figure 2, we get our first hit with payload 7 (of 1530).

FIGURE 2: Xenotix manual XSS scanning
You can also try the XSS Fuzzer where you replace parameter values with a marker, [X], and fuzz in Auto Mode. The XSS Fuzzer allows you to skip ahead to a specific payload if you know the payload position index. Circling back to the above mentioned POST parameter, I used the POST Request Scanner to build a request, establishing http://192.168.40.139/mutillidae/index.php?page=dns-lookup.phpas the URL and setting target_hostin Parameters. Clicking POST then populated the form as noted in Figure 3 and as with Manual mode, our first hits came with payload 7.
FIGURE 3: Xenotix POST Request Scanner
You can also make use of Auto Mode, as well as DOM, Multiple Parameter, and Header Scanners, as well as a Hidden Parameter Detector.

The Information Gathering modules are where we can really start to have fun with Xenotix. You first have to hook a victim browser to make use of this tool set. I set the Xenotix server to the host IP where Xenotix was running (rather than the default localhost setting) and checked the Semi Persistent Hook checkbox. The resulting payload of
was then used with Mutillidae’s Pen Test Tool Lookup to hook a victim browser on a different system running Firefox on Windows 8.1. With the browser at my beck and call, I clicked Information Gathering where the Victim Fingerprinting module produced:
Again, entirely accurate. The Information Gathering modules also include WAF Fingerprinting, as well as Ping, Port, and Internal Network Scans. Remember that, as is inherent to its very nature, these scans occur in the context of the victimized browser’s system as a function of cross-site scripting.

Saving the most fun for last, let’s pwn this this thang! A quick click of XSS Exploitation offers us a plethora of module options. Remember, the victim browser is still hooked (xooked) via:
I sent my victim browser a message as depicted in Figure 4 where I snapped the Send Message configuration and the result in the hooked browser.

FIGURE 4: A celebratory XSS message
Message boxes are cute, Tabnabbing is pretty darned cool, but what does real exploitation look like? I first fired up the Phisher module with Renren (the Chinese Facebook) as my target site, resulting in a Page Fetched and Injected message and Renren ready for login in the victim browser as evident in Figure 5. Note that my Xenotix server IP address is the destination IP in the URL window.

FIGURE 5: XSS phishing Renren
But wait, there’s more. When the victim user logs in, assuming I’m also running the Keylogger module, yep, you guessed it. Figure 6 includes keys logged.

FIGURE 6: Ima Owned is keylogged
Your Renren is my Renren. What? Credential theft is not enough for you? You want to deliver an executable binary? Xenotix includes a safe, handy sample.exeto prove your point during demos for clients and/or decision makers. Still not convinced? Need shell? You can choose from JavaScript, Reverse HTTP, and System Shell Access. My favorite, as shared in Figure 7, is reverse shell via a Firefox bootstrapped add-on as delivered by XSS Exploitation-->System Shell Access-->Firefox Add-on Reverse Shell. Just Start Listener, then Inject (assumes a hooked browser).

FIGURE 7: Got shell?
Assuming the victim happily accepts the add-on installation request (nothing a little social engineering can’t solve), you’ll have system level access. This makes pentesters very happy. There are even persistence options via Firefox add-ons, more fun than a frog in a glass of milk.

In Conclusion

While this tool won’t replace proxy scanning platforms such as Burp or ZAP, it will enhance them most righteously. Xenotix is GREAT for enumeration, information gathering, and most of all, exploitation. Without question add the OWASP Xenotix XSS Exploit Framework to your arsenal and as always, have fun but be safe. Great work, Ajin, looking forward to more, and thanks to the voters who selected Xenotix for this month’s topic. If you have comments, follow me on Twitter via @holisticinfosec or email if you have questions via russ at holisticinfosec dot org.
Cheers…until next month.

Acknowledgements

Ajin Abraham, Information Security Enthusiast and Xenotix project lead

Volatility 2.3 and FireEye's diskless, memory-only Trojan.APT.9002

$
0
0
If you needed more any more evidence as to why your DFIR practice should evolve to a heavy focus on memory analysis, let me offer you some real impetus.
FireEye's Operation Ephemeral Hydra: IE Zero-Day Linked to DeputyDog Uses Diskless Method, posted 10 NOV 2013 is specific to an attack that "loaded the payload  directly into memory without first writing to disk."As such, this"will further complicate network defenders’ ability to triage compromised systems, using traditional forensics methods." Again, what is described is a malware sample (payload) that " does not write itself to disk, leaving little to no artifacts that can be used to identify infected endpoints."This FireEye analysis is obviously getting its share of attention, but folks are likely wondering "how the hell are we supposed to detect that on compromised systems?"
Question: Why does Volatility rule?
Answer: Because we don't need no stinking file system artifacts.
In preparation for a Memory Analysis with Volatility presentation I gave at SecureWorld Expo Seattle last evening, I had grabbed the malware sample described in great length by FireEye from VirusShare (MD5 104130d666ab3f640255140007f0b12d), executed it on a Windows 7 32-bit virtual machine, used DumpIt to grab memory, and imported the memory image to my SIFT 2.14 VM running Volatility 2.3 (had to upgrade as 2.2 is native to SIFT 2.14). 
I had intended to simply use a very contemporary issue (3 days old) to highlight some of the features  new to the just released stable Volatility 2.3, but what resulted was the realization that "hey, this is basically one of the only ways to analyze this sort of malware."
So here's the breakdown.
The FireEye article indicated that "this Trojan.APT.9002 variant connected to a command and control server at 111.68.9.93 over port 443."
Copy that. Ran vol.py --profile=Win7SP1x86 -f WIN-L905IILDALU-20131111-234404.raw netscan and quickly spotted 111.68.9.93 as seen in Figure 1.

Figure 1
 I was interested in putting timeliner through its paces as it is new to Volatility in 2.3, and was not disappointed. Issued vol.py --profile=Win7SP1x86 -f WIN-L905IILDALU-20131111-234404.raw timeliner --output=body --output-file=output.body and spotted 111.68.9.93 in network connections tied closely to a timestamp of 1384212827? Er? That's Unix timestamp. Translated to human readable: Mon, 11 Nov 2013 23:33:47 GMT. Check! See Figure 2.

Figure 2


Clearly PID 3176 is interesting, keep it in mind as we proceed.
The article states that "after an initial XOR decoding of the payload with the key “0x9F”, an instance of rundll32.exe is launched and injected with the payload using CreateProcessA, OpenProcess, VirtualAlloc, WriteProcessMemory, and CreateRemoteThread."
Ok, so what is PID 3176 associated with? vol.py --profile=Win7SP1x86 -f WIN-L905IILDALU-20131111-234404.raw pslist | grep 3176 will tell us in Figure 3.

Figure 3
What, what?! It's rundll32.exe. Mmm-hmm.
Strings can help us for the next step to spot CreateProcessA, OpenProcess, VirtualAlloc, WriteProcessMemory, and CreateRemoteThread as associated with PID 3176.The Volatility wiki recommends using Sysinternals strings so we can use –q and –o switches to ensure that the header is not output (-q) and that there is an offset for each line (-o), as in strings -q -o WIN-L905IILDALU-20131111-234404.raw > strings.txt. We then convert strings.txt for Volatility with vol.py --profile=Win7SP1x86 -f WIN-L905IILDALU-20131111-234404.raw strings -s strings.txt --output-file=stringsVol.txt. Now we can search for strings that include 3176 and the likes of CreateProcessA, along with offsets to see if there are associations. A search immediately produced:
04cfce5a [3176:701f8e5a] CreateProcessA
abd60bd8 [3176:00191bd8] OpenProcess
abd60ae4 [3176:00191ae4] VirtualAlloc
bedd8384 [3176:10002384] WriteProcessMemory
bedd835a [3176:1000235a] CreateRemoteThread
What we've just validated is that PID 3176 (rundll32.exe) shows indications of the five functions described by FireEye.
 Per the article, "inside the in-memory version of the Trojan.APT.9002 payload used in this strategic Web compromise, we identified the following interesting string: “rat_UnInstall. Gotcha; a quick string search says: bd75bcc0 [3176:0035fcc0] __rat_UnInstall__3176.
The  rat_UnInstall IOC is clearly associated with PID 3176.

Just for giggles, I checked one last point made by FireEye. They stated that "we also found the following strings of interest present in these 9002 RAT samples (excluding the in-memory variant): McpRoXy.exe, SoundMax.dll
I was intrigued by the "excluding the in-memory variant claim", so I did I quick check. I could, as always, be wrong (tell me if I am), buy the dlllist module seems to disagree.
vol.py --profile=Win7SP1x86 -f WIN-L905IILDALU-20131111-234404.raw dlllist -p 3176 | grep SoundMax.dll produced Figure 4.

Figure 4
When I checked the file system for C:\users\malman\SoundMax.dll, it was indeed present.
While I am operating on the belief that my analysis of  104130d666ab3f640255140007f0b12d matches the FireEye IOCs via Volatility memory analysis alone, dlllist does indicate that the malware drops SoundMax.dll on the file system. I attribute this to the possibility that my "delivery system" was different than the IE 0-day FireEye describes; I had to download the sample and execute it to replicate behavior.

Correction 15 NOV 2013:Ned Moran from FireEye contacted me to let me know that my assumption based on interpretation of the FireEye blogpost was incorrect. 104130d666ab3f640255140007f0b12d is not the diskless version of 9002; at this time FireEye is not providing hashes or sharing that sample at this time. I clearly misinterpreted their post to indicate that 104130d666ab3f640255140007f0b12d was that sample, I was incorrect and I apologize. That being said Ned assured me that I was not out of my mind and let me know "yes, my reading of your methodology is that it would have produced very similar results, the only difference being that had you would not have found the 'SoundMax.dll' string in the diskless version. So, your approach was sound you were just looking at a different sample."

Regardless, we wouldn't need any file system artifacts to confirm the presence of the diskless, memory-only version of Trojan.APT.9002 on a victim system.
Confirmed connection to 111.68.9.93 with netscan:
vol.py --profile=Win7SP1x86 -f WIN-L905IILDALU-20131111-234404.raw netscan 
Confirmed timeline for connection to 111.68.9.93 with timeliner:
vol.py --profile=Win7SP1x86 -f WIN-L905IILDALU-20131111-234404.raw timeliner --output=body --output-file=output.body
Identified rundll32.exe as owner of the suspect PID (3176) with pslist:
vol.py --profile=Win7SP1x86 -f WIN-L905IILDALU-20131111-234404.raw pslist | grep 3176
Used strings as analysis to further confirm:
vol.py --profile=Win7SP1x86 -f WIN-L905IILDALU-20131111-234404.raw strings -s strings.txt --output-file=stringsVol.txt 
Used dlllist to call out SoundMax.dll:
vol.py --profile=Win7SP1x86 -f WIN-L905IILDALU-20131111-234404.raw dlllist -p 3176 | grep SoundMax.dll

One more time, with feeling: Why does Volatility rule? Hopefully, I've helped answer that...again.
Cheers!

CTIN Digital Forensics Conference - No fluff, all forensics

$
0
0
For those of you in the Seattle area or willing to travel who are interested in digital forensics there is a great opportunity to learn and socialize coming up in March.
The CTIN Digital Forensics Conference will be March 13 though 15, 2013 at the Hilton Seattle Airport & Conference Center. CTIN, the Computer Technology Investigators Network, is non-profit, free membership organization comprised of public and private sector computer forensic examiners and investigators focused on the areas of high-tech security, investigation, and prosecution of high-tech crimes for both private and public sector.

Topics slated for the conference agenda are many, with great speakers to discuss them in depth:
Windows Time Stamp Forensics, Incident Response Procedures, Tracking USB Devices, Timeline Analysis with Encase, Internet Forensics, Placing the Suspect Behind the Keyboard, Social Network Investigations, Triage, Live CDs (WinFE & Linux)
F-Response and Intella, Lab - Hard drive repair, Mobile Device Forensics, Windows 7/8 Forensics
Child Pornography, Legal Update, Counter-forensics, Linux Forensics, X-Ways Forensics
Expert Testimony, ProDiscover, Live Memory Forensics, Encase, Open Source Forensic Tools
Cell Phone Tower Analysis, Mac Forensics, Registry Forensics, Malware Analysis, iPhone/iPad/other Apple products, Imaging Workshop, Paraben Forensics, Virtualization Forensics


Register before 1 DEC 2012 for $295, and $350 thereafter.

While you don't have to be a CTIN member to attend I strongly advocate your joining and supporting CTIN.

Viewing all 134 articles
Browse latest View live